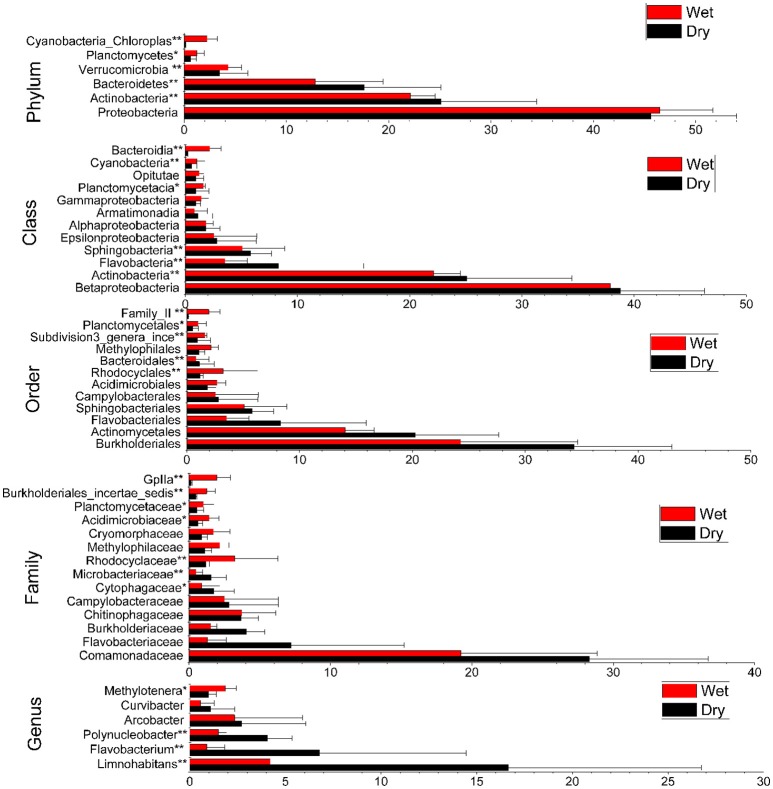
Figure 3.
Comparisons of bacterioplankton taxonomy profiles of the dry and wet seasons based on the relative abundance of OTUs. Comparisons were performed at levels of Phylum, Class, Order, Family, and Genus. The most frequently detected taxa (above 1% of relative abundance) in each level are shown. Means of the relative abundance for each taxon at each taxonomical level between the two seasons are compared (*p < 0.05, **p < 0.01; mean ± s.e.m).

