FIGURE 2.

The analysis process of scalp spatial distribution for the relationship between spectral entropy and subjects’ SRT scores.

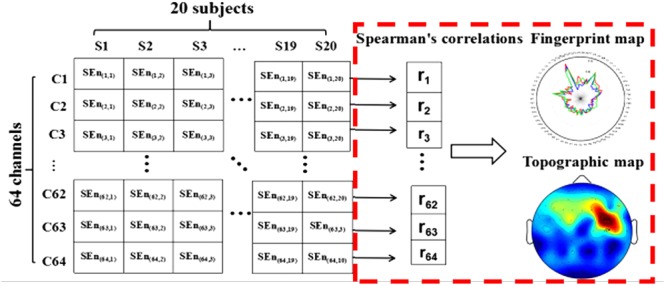
The analysis process of scalp spatial distribution for the relationship between spectral entropy and subjects’ SRT scores.