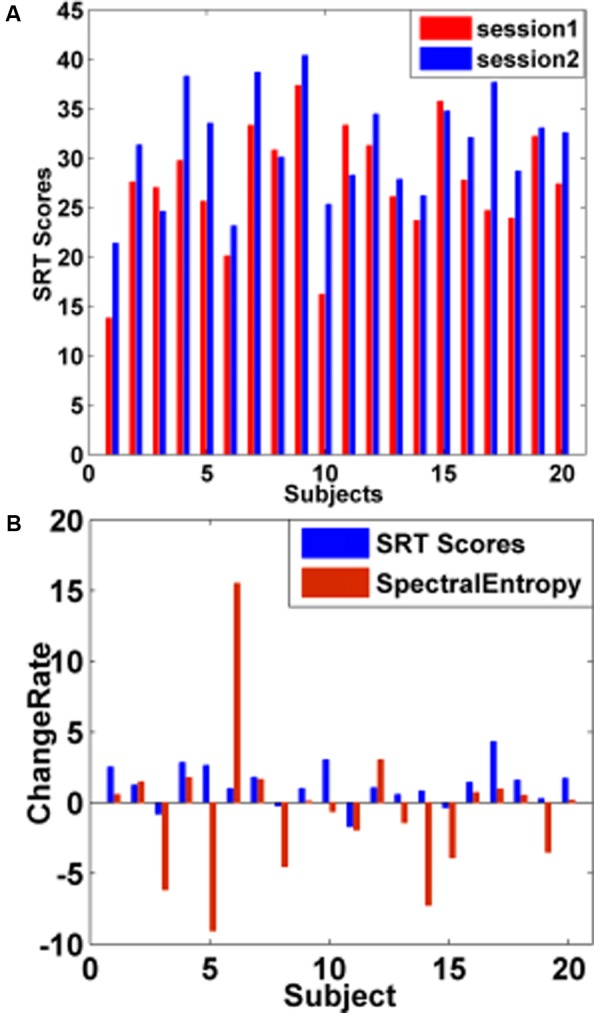
FIGURE 6.

WM performance changes by short-time training. (A) Changes in subjects’ SRT scores before and after training. The red bar represented the subjects’ SRT scores before training, and the blue bar denoted the subjects’ SRT scores after training. After training, 16 subjects’ SRT scores increased and 4 subjects’ SRT scores showed a downward trend. (B) Change rate (CR) of subjects’ SRT scores and spectral entropies between sessions. The blue bar represented the CR of subjects’ SRT scores, and the red bar denoted the CR of spectral entropies before and after training.
