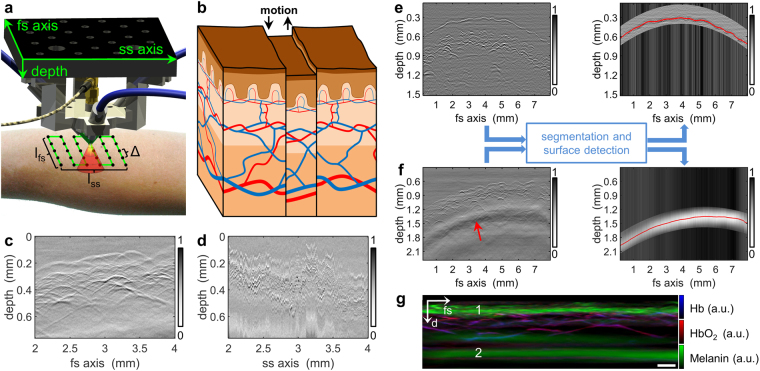
Figure 1.
Principle of the proposed motion correction algorithm for RSOM. (a) Schematic of the detector-illumination unit, which is raster-scanned over the region of interest at a step size of Δ to give final dimensions lfs × lss. The detector features a cone-shaped sensitivity field (red/yellow). (b) Schematic illustrating how movement (black arrows) during RSOM scanning causes discontinuities in the surface of the epidermal layer as well as disruption of vessels. (c) B-scan of healthy human skin along the fs-axis, showing no discontinuities between subsequent positions. (d) B-scan of the sample in panel c along the ss-axis, showing large motion-induced artifacts. (e) B-scan of healthy human palm (left panel) after segmentation and surface detection were applied (right panel). The stratum corneum is separated clearly from the dermal papillae. (f) B-scan of healthy lower arm (left panel) with segmentation and surface detection applied (right panel). Segmentation was performed using only the low-frequency optoacoustic signal 600 µm below the skin surface (red arrow). The red curve indicates the maximum value of the low-frequency band. (g) Multispectral vertical MAP of healthy lower arm reconstructed without bandpass filtering. The low-frequency signal (2) shows the spectral signature of melanin and follows the shape of the epidermal layer (1). Scale bar, 250 µm. Abbreviations: d: depth; fs: fast-scanning; Hb, deoxyhemoglobin; HbO2, oxyhemoglobin; ss, slow-scanning.

