
Figure 4.
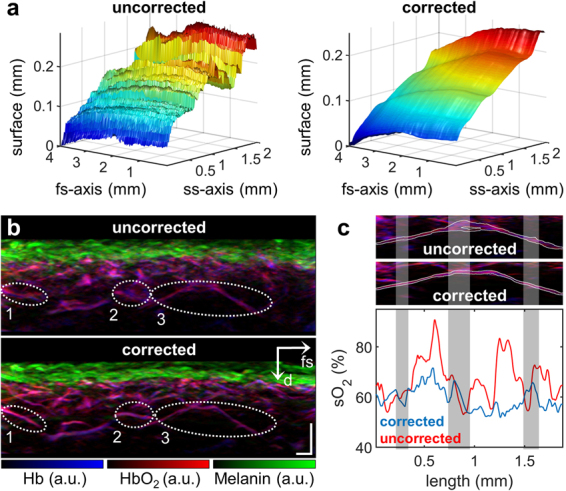
Implementation of the motion correction algorithm in MSOM. (a) Skin surface of healthy lower arm area before and after motion correction. Strong motion artifacts are visible even along the fs-axis because of the long measurement time necessary for multispectral acquisition. Nevertheless, the algorithm is able to generate a smooth, continuous surface. (b) Vertical MAP of unmixed chromophores in the lower arm. Individual vessels enclosed by ellipses 1 and 2 are resolved only after motion correction. The vessel enclosed by ellipse 3 is further analyzed in panel c. (c) Segmentation of the vessel within ellipse 3 in panel b and outlined in white (top and middle panels), followed by measurement of blood oxygenation (oxygen saturation, sO2) across the diameter of the blood vessel within the segmented area (lower panel). The oxygenation level is plotted from left to right along the vessel. Gray bands indicate regions of vessel bifurcation. Scale bar, 250 µm. Abbreviations: d: depth; fs: fast-scanning.