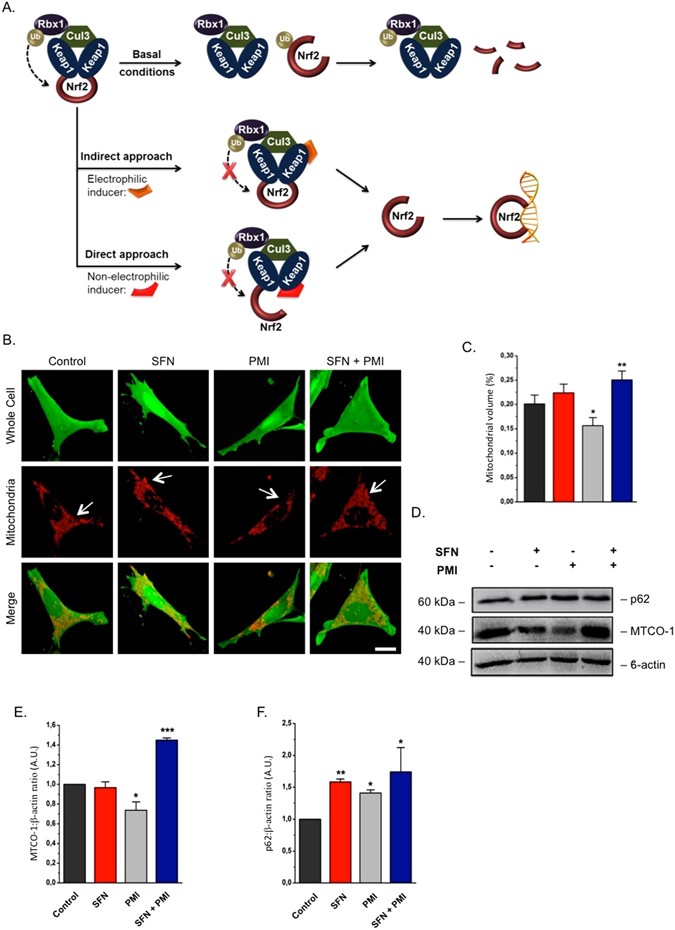
Figure 1.

SFN halts the PMI-induced reduction of mitochondrial biomass. (A) Graphical representation of the Keap1-Nrf2 pathway and the different modes of chemical intervention35. (B) Representative 3-D confocal images demonstrating differences in mitochondrial mass of cells treated with DMSO vehicle control, 1 μM SFN and/or 10 μM PMI for 24 h. Cells were loaded with TMRM (red) and Fluo-4 am (green) to visualize mitochondria and the whole cell respectively. Scale bar represents 10 μm. (C) Quantification of mitochondrial volume, determined as the proportion of the whole cell volume occupied by the mitochondrial network (n > 20 cells; *p < 0.05, **p < 0.01) (D) Western blot analysis of p62 and MTCO-1 levels in MEFs treated with DMSO vehicle control, PMI (10 μM) and/or SFN (1 μM) for 24 h. β-actin is shown as a loading control. (E and F) Graphs show (E) MTCO-1:β-actin and (F) p62:β-actin ratio band density analysis (n = 3, *p < 0.05, **p < 0.01, ***p < 0.001). All values are mean ± SD.
