Figure 3.
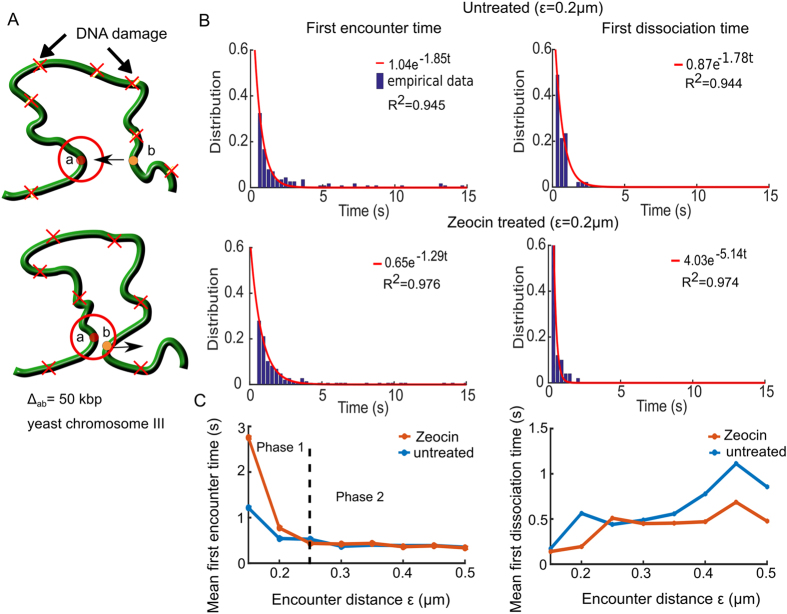
Two loci dynamics before and after Zeocin treatment. (A) Two tagged loci (a and b, circles) separated by a genomic distance Δab = 50 kbp. When the loci are within a distance ε μm (red circle), they are considered to encounter for computing the FET, and above ε (lower) for the FDT. We analyzed the untreated and Zeocin treated cases, where Zeocin induces DNA damages (red X) at random positions along the DNA. (B) The FET (left column) and FDT (right) empirical distributions in the untreated (upper) and Zeocin treated (lower) cases, fitted by a exp (−λt) (red curves), where the reciprocal of λ is the MFET and MFDT in their respective cases. R 2 values from the fit are reported in each box. (C) The MFET (left) is plotted with respect to the encounter distance ε for the untreated (blue) and Zeocin treated (orange) cases. For the MFET (left), both curves are at a plateau of at 0.5 s (phase 2) above ε > 0.25 μm. The MFDT (right) increase with ε from 0.2 s at ε = 0.15 μm to 0.5 s at ε = 0.5 μm for the untreated (blue) and Zeocin treated (orange) case.

