Figure 4.
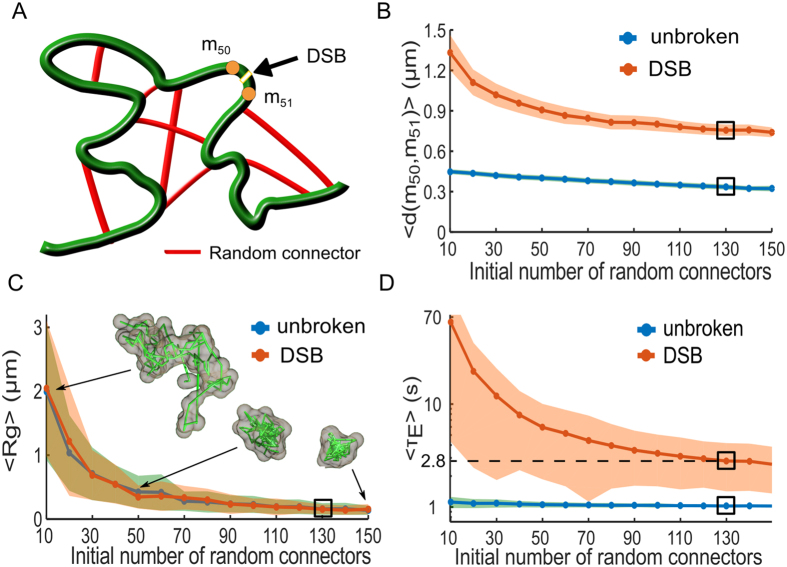
Local force destabilization following a double-strand DNA break (DSB). (A) Schematic representation of a randomly cross-linked (RCL) polymer, where N c random connectors (red) are initially added to the linear backbone (green) of a Rouse chain. A DSB is induced between monomers m 50 and m 51, modeled by removing the spring connectors between them and all random connectors to these monomers. (B) Mean maximal distance 〈Max(d(m 50, m 51))〉 for both the unbroken loci (blue) and DSB (orange) simulations, where the shaded are the STD. The black rectangle indicates the value obtained for N c = 130 matching L c (eq. 3) measurements reported in ref. 2, where we obtain 0.37 μm for the unbroken and 0.86 μm for DSB simulation. (C) The mean radius of gyration (MRG), 〈R g〉, obtained from simulations of 100 monomer RCL polymer (blue) and after DSB between monomers 50 and 51 (orange). Three sample polymer realizations are shown for N c = 10, 50, and 150. For N c = 130 we obtain 〈R g〉 = 0.15 μm for both cases. (D) The mean first encounter time (MFET) 〈τ E〉 for m 50 and m 51 plotted with respected to N c for both the unbroken (blue) and DSB (orange) simulations. The MFET is displayed on a semi-log axes, where before DSB we obtained 〈τ E〉 = 1 s and 2.8 s following DSB and the removal of 5 random connectors on average.

