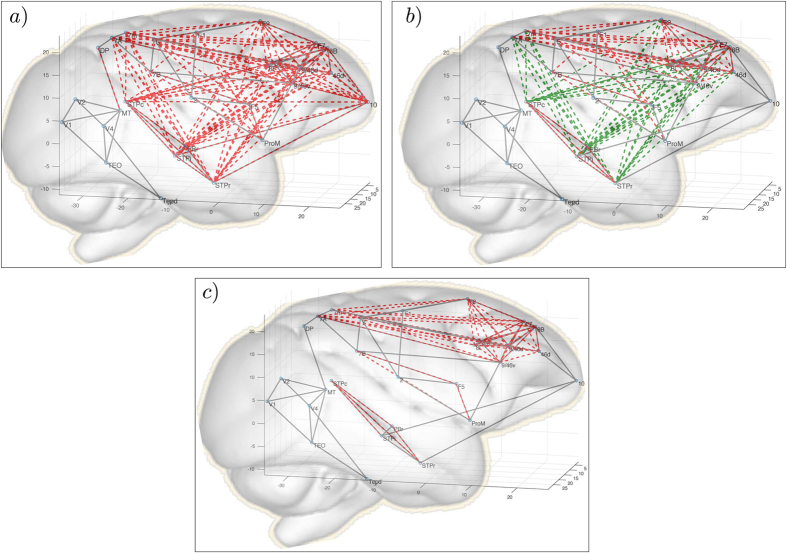
Figure 7.
Simulation of the Macaque connectome. Structural links are shown with grey lines. Remote and direct synchrony links with are shown by dashed green and red lines, respectively. The parameters are , , where Hz, c = 10 m/s and D ij is the internodal distance matrix taken from ref. 23. Frequencies are taken as inverse timescales for resting-state case from ref. 43. For (panel a), node 10 is synchronous with a large cluster of nodes in the frontal and temporal cortices. When we increase the natural frequency of node 10 to its fast component (), the hub becomes asynchronous while driving remote synchronization of fronto-temporal regions (panel b). Increasing the frequency further () frontal and temporal regions become functionally disconnected (panel c).

