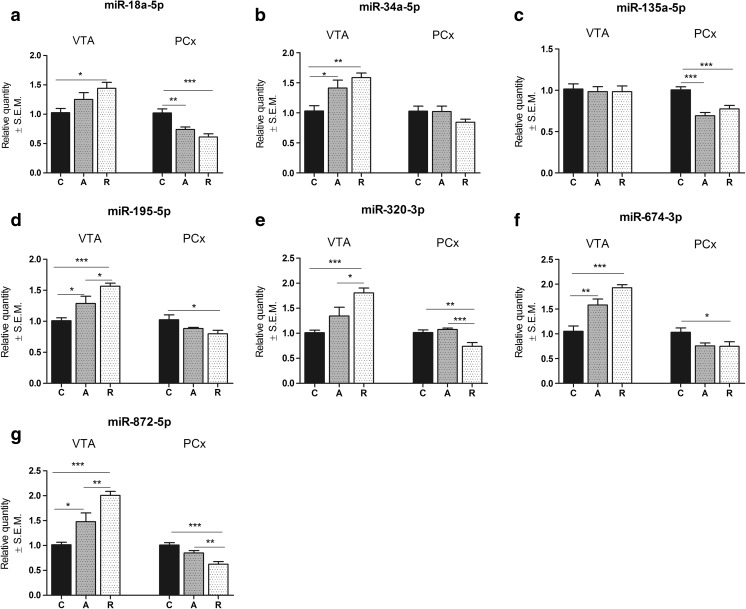
Fig. 3.
The influence of 2 weeks of CMS on the expression level of a set of seven miRNAs in mesocortical circuit of control (C), anhedonic (A), and resilient animals (R). Left panel of each graph represents particular expression in ventral tegmental area (VTA), and right panel represents results from miRNA expression in prefrontal cortex (PCx). miRNA expression represented as relative quantity with regard to control analyzed by one-way ANOVA followed by Tukey’s post hoc test. n = 10; *p < 0.05, **p < 0.01, ***p < 0.001

