Figure 2.
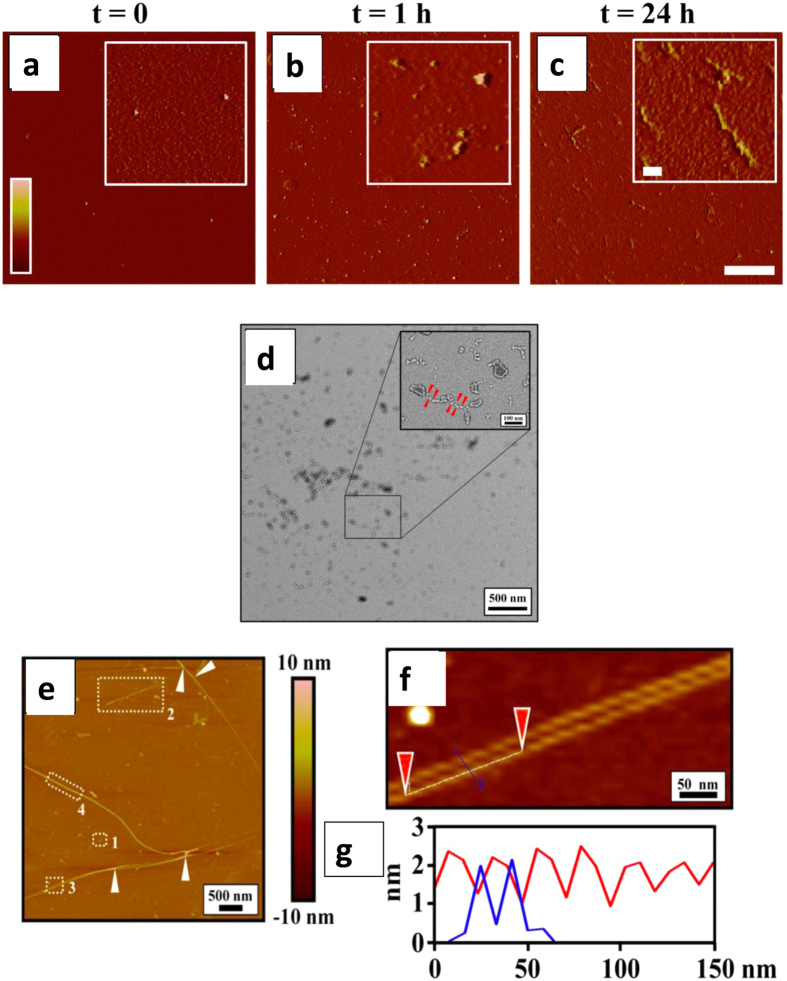
Atomic force microscopy (AFM) and transmission electron microscopy (TEM) analysis of p17. (a–c) p17 at 4 μM in 10 mM PB (pH 7.4) was incubated at 37 °C for different times (t = 0, t = 1 h and t = 24 h), sampled and left to adsorb on freshly cleaved mica. AFM images were obtained in taping mode and are shown as amplitude data (Z range: −10/+50 mV). Scale bar = 2 µm, inset = 200 nm. (d) TEM micrographs of freshly diluted p17 (4 μM in 10 mM PB pH 7.4). The insets in panel show details of the micrograph at high resolution. The red arrows point to annular structures and rosary-like structures of p17 as an indication of oligomerization process progression. The micrographs are representative of a minimum of 10 different areas. Scale bar = 500 nm, inset = 100 nm. (e–g) Atomic force microscopy in height of p17 incubated at 37 °C for 24 h shows the presence of globular structures (1), protofibrils (2) and fibrils (3 and 4). The white arrows indicate the presence of twisted protofibrillar subunits. Sample areas marked by dashed rectangles in E3 are reported with a high magnification in (f) Moreover, the high profile of fibril analysis, between the positions marked by red arrows, is reported (g). (g) Sample marked between blue and purple triangles indicate the high profile of a single filament of ~15– 20 nm of diameter and ~2 nm in height.

