Fig. 3.
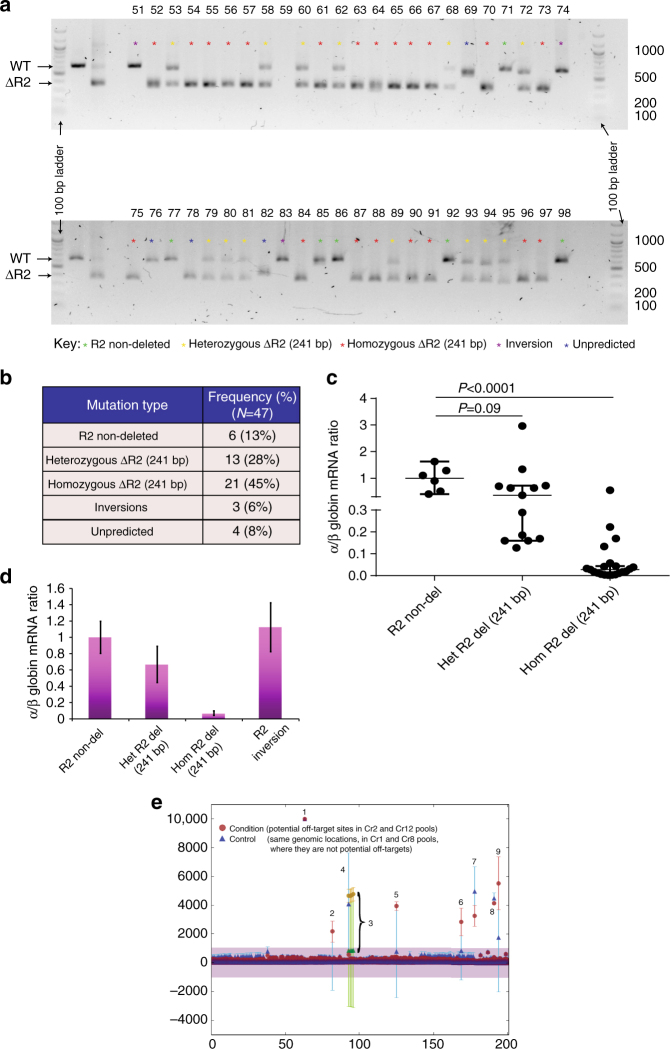
Single-cell clone analysis of targeted deletion of MCS-R2. a Gel electrophoresis image of genomic DNA from 48 individual single-cell clones genome-edited using CRISPR pair Cr2 and Cr12 (from three biological independent donors) analyzed by PCR. The amplicon from the wild-type allele is 613 bp and the mutated amplicon is 372 bp. Clones are numbered 51–98 and clone 59 failed to amplify. Extended genotype analysis of these clones by sequencing is presented in Supplementary Fig. 4. b Frequency of different types of mutations generated. c α/β-globin mRNA ratios of individual clones of erythroid cells which are non-deleted (R2 non-del) (n = 6) and heterozygous (Het R2 del.) (n = 13) or homozygous (Hom R2 del.) (n = 21) for a 241 bp deletion of MCS-R2 region analyzed by qPCR; median (horizontal bar) and 95% confidence interval (error bar) are shown and P-values were calculated using Mann–Whitney U-test. d α/β-globin mRNA ratios of erythroid cells, which has no deletion (n = 6), heterozygous deletion (n = 13), homozygous deletion (n = 21), and inversion (n = 3) of MCS-R2 analyzed by qPCR. Means and SEM are shown. e Meta-plot of all off-target loci for CRISPR pair Cr2 and Cr12. All captured sites are plotted on the same x-axis, showing ±100 bases from each potential off-target site. Counts deviating from the reference sequence, which are normalized to 10,000 counts are plotted in the y-axis. The values are means of the libraries where each library is a pool of five independent clones. The shaded violet area denotes ±1000 counts and only data over this threshold were considered as off-target. Error bars represent SEM for each base at each locus. Potential off-target hits for Cr2 and Cr12 (condition) are plotted alongside those of a control group (control). The numbers are annotated in Supplementary Table 4. All of the variations from the reference sequence were shown to be known SNPs or indels or novel variations common to both control and condition and therefore unrelated to potential off-target activity

