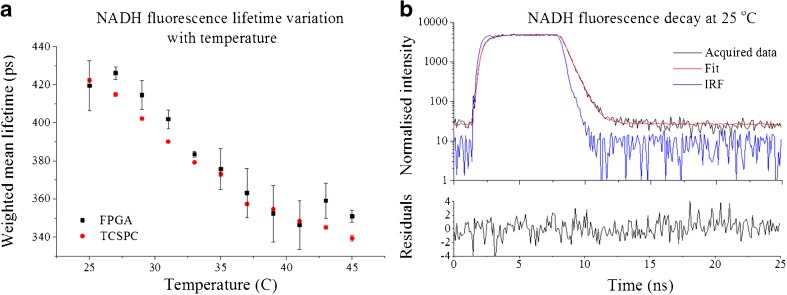
Fig. 5.
a Variation of NADH mean fluorescence lifetime with temperature for TCSPC and FPGA detection methods; b fluorescence decay of NADH at 25 °C, measured with the FPGA detection methodology. Measurements were realised at 460 nm using 375 nm excitation light at 40 MHz with a 4-window architecture and 256 bins in the histogram. Approximately 500,000 photons were collected for each measurement. Error bars in (A) show the standard deviation

