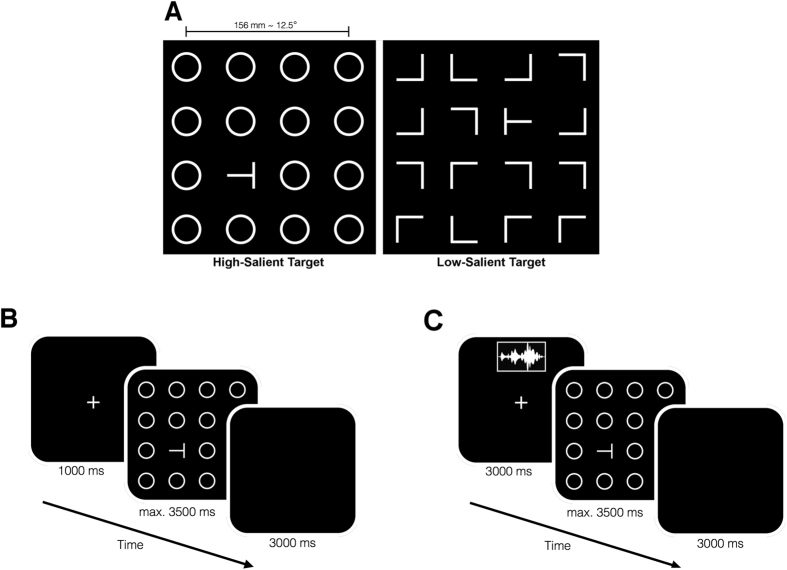
Figure 1.
Visual search task details for Experiment 1. (A) The figure shows sample visual arrays for high-salient (left) and low-salient (right) target conditions. (B) Timeline for the visual search task is illustrated. Participants were given maximum 3500 ms to find the target. (C) Timeline for the search task with the auditory cues is illustrated. Sounds were presented during the fixation period. The sound offset was aligned with the start of the search period.

