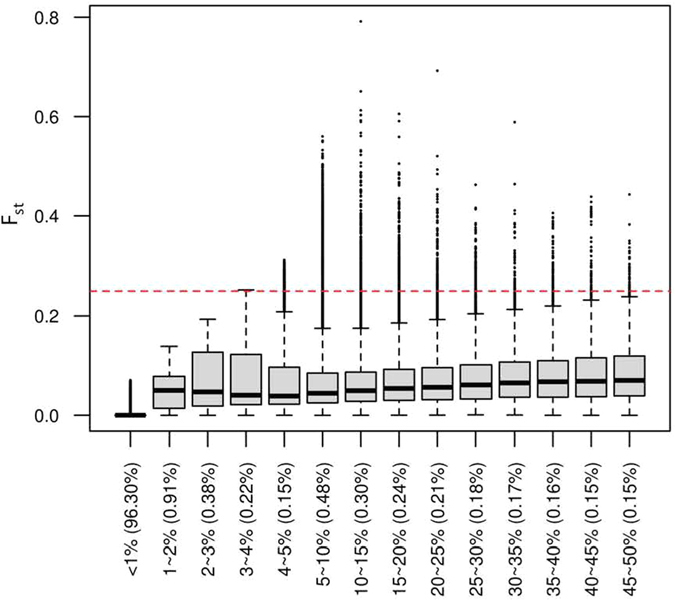
Figure 2.

Boxplots of the Fst values of our WES data, according to MAFs of variants. The percentages of the variants which have the range of MAF over the number of all the variants in WES data are shown in x axis with parenthesis; the red line represents Fst cut-off 0.25 according to Wright’s Fst criteria23. Cardoso, et al.23 and Strauss, et al.24 defined a gene with PD if it contains at least one Single Nucleotide Polymorphism (SNP) with Fst value greater than 0.25.
