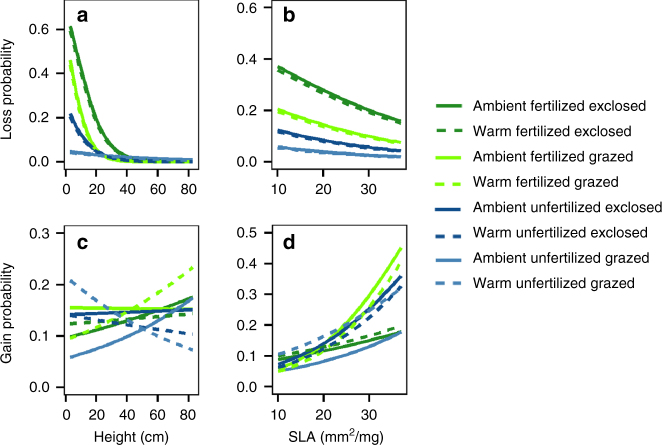
Fig. 4.
Impacts of plant height and specific leaf area on probability of species losses and gains. Modeled probability of species’ losses and gains as functions of their height a, c and SLA b, d under combinations of warming, grazing and fertilization treatments. Fertilized plots are shown in green, unfertilized in blue. Herbivore exclosures are indicated with dark color, grazed plots in light color. Dashed line indicates prediction for warmed plots, solid line for unwarmed plots. Modeling results can be found in Supplementary Tables 3, 4)

