. 2017 May 24;41(4):303–315. doi: 10.4093/dmj.2017.41.4.303

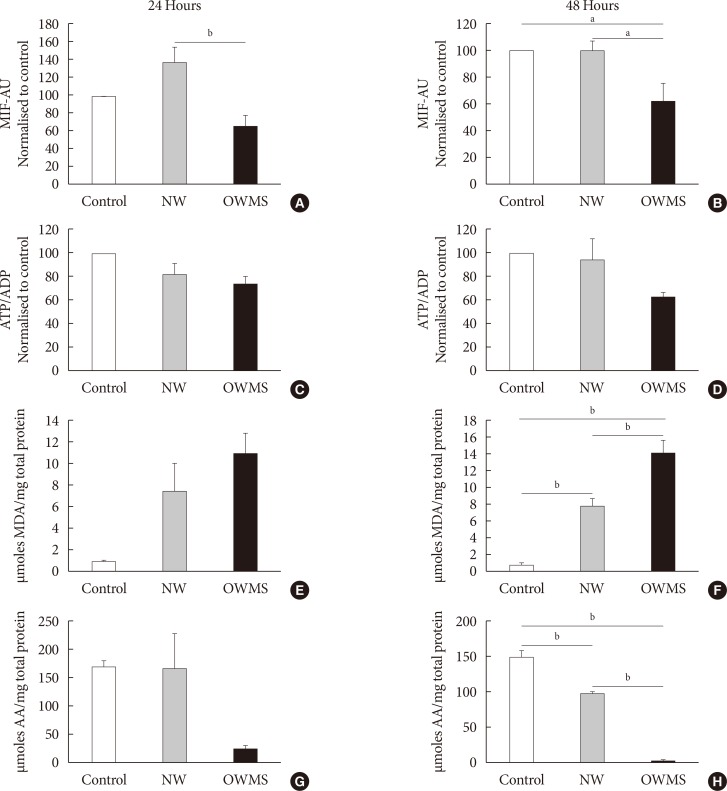
Fig. 4. Effect of the proportion of free fatty acids (FFAs) on mitochondrial function, lipid peroxidation, and antioxidant capacity of MIN6 (mouse insulinoma) cells. The concentration of fatty acids corresponding to the lipid profile of obese adolescents with metabolic syndrome (OWMS) adolescents was adjusted so as to have the same total amount of FFAs as the serum of normal weight (NW) adolescents (103.25 mg/dL), but the original proportions were conserved (Table 2). MIN6 cells were treated for 24 (A, C, E, G) or 48 hours (B, D, F, H) with the NW or OWMS profiles. Control cells were grown without adding fatty acids. (A, B) The potential of the internal mitochondrial membrane was quantified as the mean intensity of fluorescence (MIF) emitted by MitoTracker during flow cytometry analyses. (C, D) The adenosine triphosphate/adenosine diphosphate (ATP/ADP) ratio was determined using bioluminescence. (E, F) The production of lipid peroxidation products was quantified using the thiobarbituric acid reactive substance assay and is expressed as the concentration of malondialdehyde (MDA) normalized to the total milligram (mg) of protein. (G, H) The capacity to capture peroxynitrite is expressed relative to the antioxidant activity of ascorbic acid (AA) and normalized to the total protein content for each group. AU, arbitrary unit. aIndicates P<0.05, bP<0.01, using analysis of variance followed by Tukey test of multiple comparisons.

Fig. 4