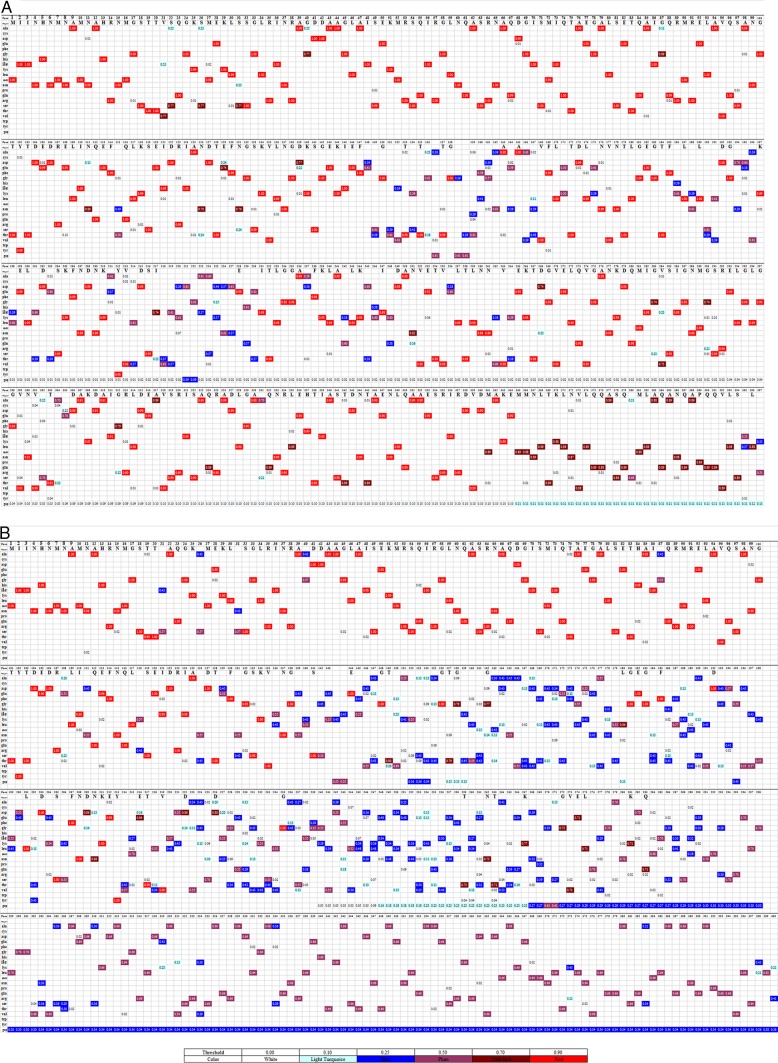
FIG 1.
Visualization of the mutant variable regions of the deduced SFB FliC3 and FliC4 amino acid sequences. Fifty-two rat SFB fliC3 gene sequences, 42 rat SFB fliC4 gene sequences, 66 mouse SFB fliC3 gene sequences, and 51 mouse SFB fliC4 gene sequences were obtained by clone library sequencing. For each sample, duplicate sequences were deleted, and one sequence was preserved for further analysis. Deduced amino acid sequences that were shorter than half the length of the SFB FliC genes were removed. (A) In total, 76 mouse SFB FliC3 and FliC4 sequences obtained in this study and 6 mouse SFB FliC3 and FliC4 sequences downloaded from the NCBI database were used for alignment. (B) Fifty-four rat SFB FliC3 and FliC4 sequences obtained in this study and 2 rat SFB FliC3 and FliC4 sequences downloaded from the NCBI database were used for alignment. JProfileGrid software (33) was used for multiple-sequence alignment visualization. Each row represents different amino acids. Different colors represent homology at the site for each amino acid. The numbers represent the residue frequency occurring at each column position.

