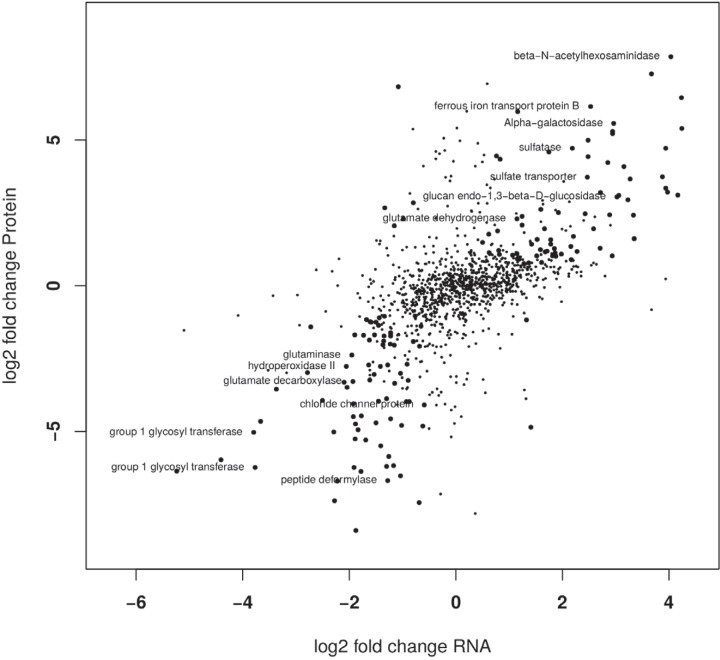
FIG 3.
Correlation between fold change in relative abundance at the transcript and protein levels. Fold changes indicate differences between A. muciniphila grown on mucin and glucose. Large filled circles represent genes that were significantly differentially abundant at both levels. Positive values correspond to the mucin condition while negative values reflect the glucose condition. (Spearman rank coefficient = 0.581.).

