
FIG 4.
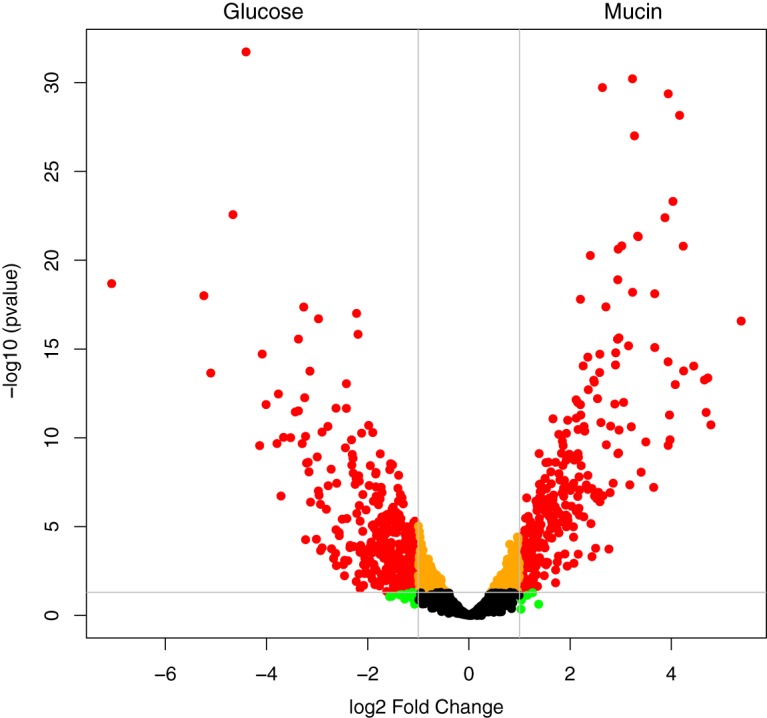
Volcano plot of the distribution of gene expression for A. muciniphila grown on glucose versus mucin. Positive fold change indicates upregulation under the mucin condition. Red data points indicate genes having a P of < 0.05 and fold change ≥2.