
Fig. 2.
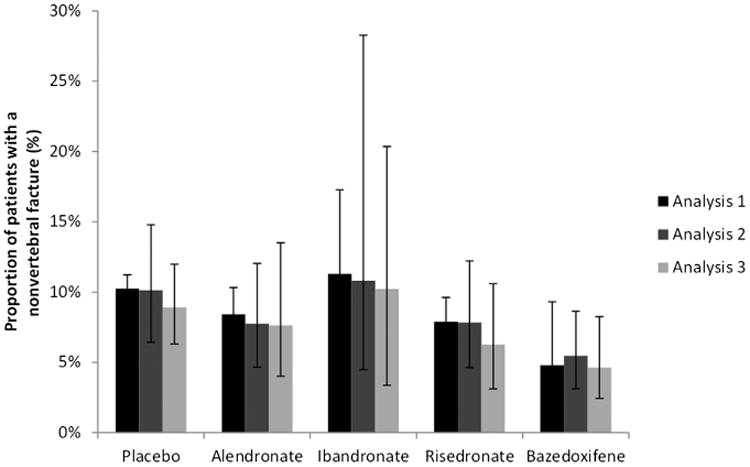
Modeled probability of a nonvertebral fracture (along with 95% credible interval) for each treatment. Analysis 1: Unadjusted Comparison based on AD of bisphosphonates and FRAX > = 20% subgroup for bazedoxifene (N = 24,058); Analysis 2: Meta-regression controlling for baseline risk (placebo response) based on AD of bisphosphonates and all FRAX subgroups for bazedoxifene (N = 29,267); Analysis 3: Meta-regression controlling for baseline risk (placebo response in bisphosphonate trials and FRAX for bazedoxifine trial) based on AD of bisphosphonates and IPD for bazedoxifene (N = 29,267). The treatment effects were centered at a 10-year fracture risk > = 20%. FRAX, Fracture Risk Assessment Tool.