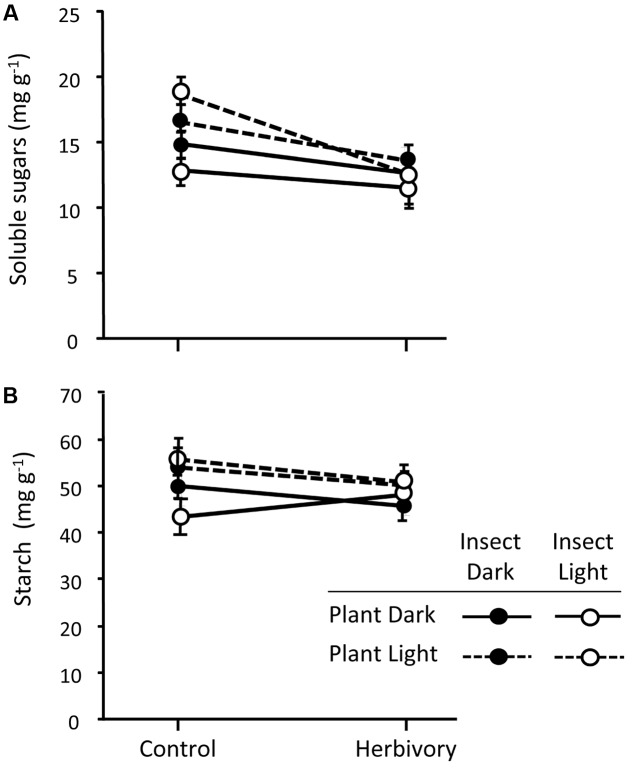
FIGURE 7.
Concentration of soluble sugars (A) and starch (B) in the basal section of the stem of control and weevil-exposed 3-year-old Maritime pine plants under a factorial combination of light availability (sunlight/darkness) applied to the plant and the insect. Weevils were allowed to feed on the plants for 6 days. Mean ± SE in the basal part of the stems averaged across the three pine populations are shown (N = 9 for control plants and N = 18 for herbivory-exposed plants). See results of the corresponding mixed models in Table 2.

