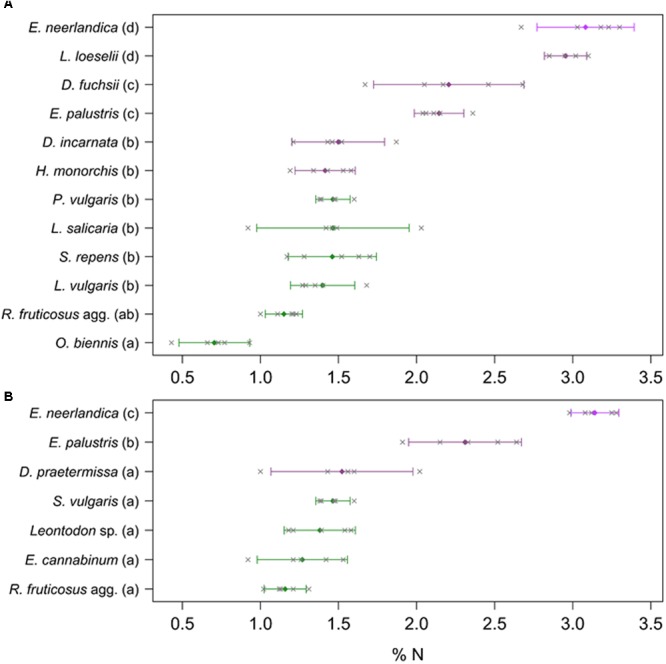
FIGURE 5.

Total N content of plants at Westhoek (A) and Ter Yde (B). Non-orchids are in green and orchids are in violet (with E. neerlandica in pink violet); n = 5 replicates per species. Colored diamonds represent mean values whereas gray crosses show the five corresponding measures. Bars represent 95% confidence intervals; different letters indicate statistically significant differences (P < 0.05).
