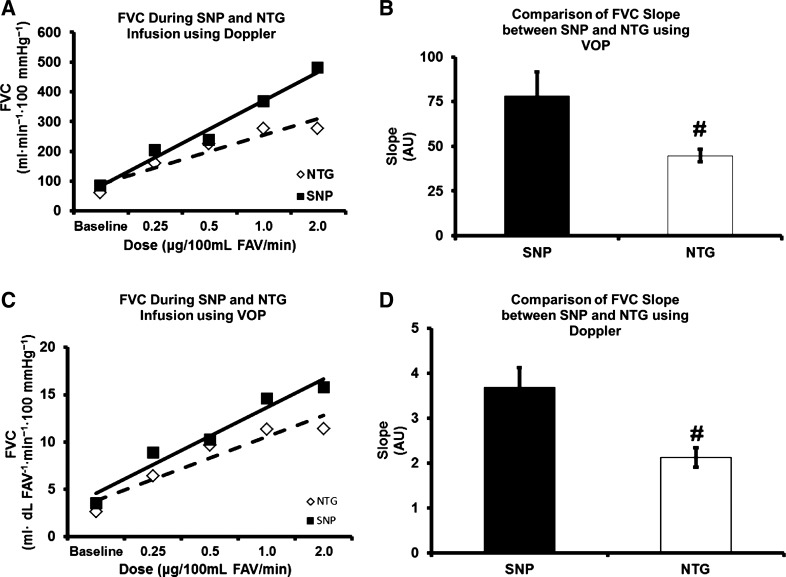
Fig. 3.
A [venous occlusion plethysmography (VOP)] and B (Doppler ultrasound): representative slopes of one of the participants for forearm vascular conductance (FVC) during sodium nitroprusside (SNP) and nitroglycerin (NTG). C and D: FVC slope during SNP and NTG. #P < 0.05, significant difference between SNP and NTG.

