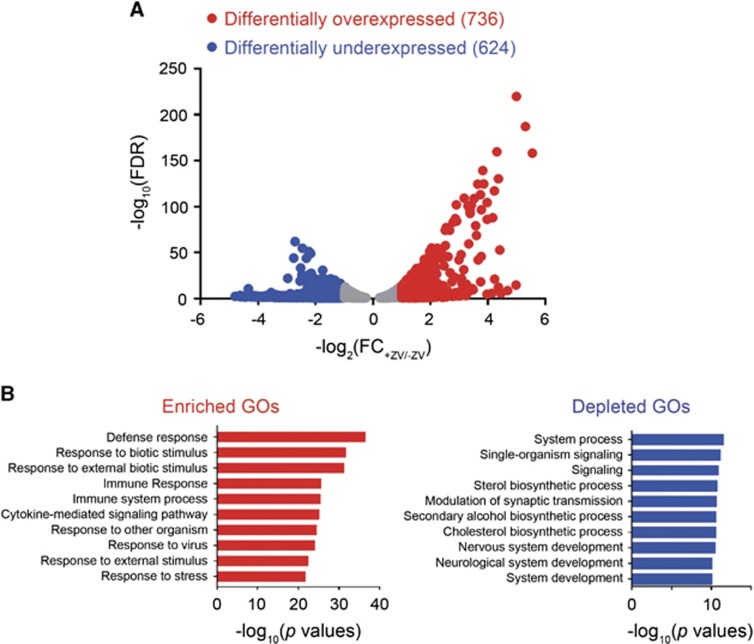
Figure 4.
RNA-Seq analysis of mock and ZIKV-infected primary hRPTEpiCs at 48 h post infection. (A) Volcano plot of genes differentially expressed in mock and ZIKV-infected hRPTEpiCs. (B) Genes with differential expression between mock and infected hRPTEpiCs were subjected to gene ontology (GO) analyses. The top 10 most significantly upregulated and downregulated biological processes are shown in red and blue, respectively.

