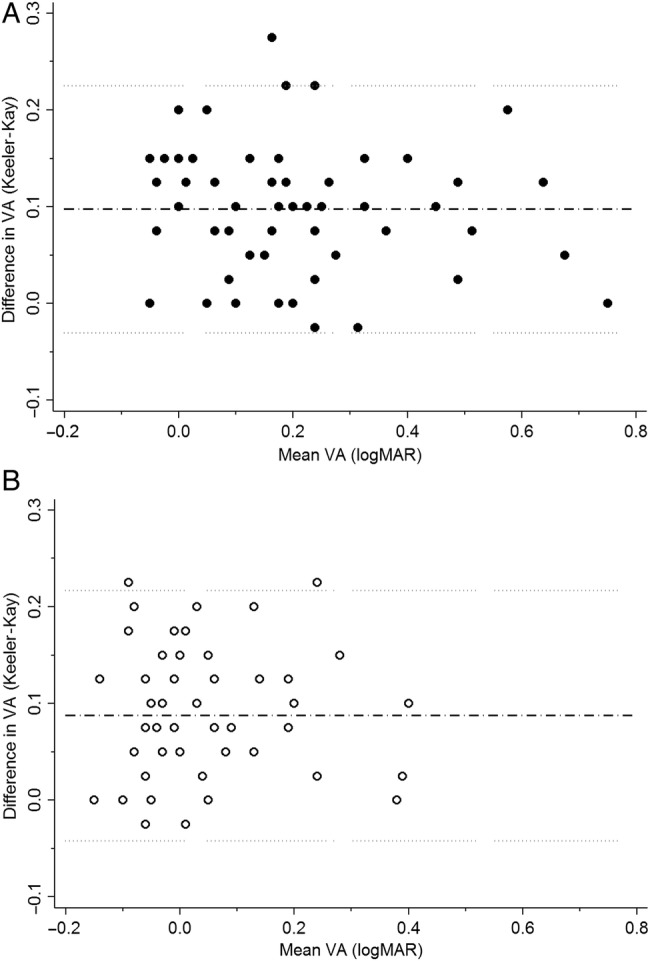
Figure 1.

(A) Bland-Altman plot of the logMAR crowded Kay Picture and logMAR crowded Keeler Letter VA results for the amblyopic eye. Mean difference indicated by black dashed line (0.098 logMAR), and upper and lower 95% limits of agreement indicated by grey dotted lines. (B)Bland-Altman plot of the logMAR crowded Kay Picture and logMAR crowded Keeler Letter VA results for the fellow eye. Mean difference indicated by black dashed line (0.088 logMAR), and upper and lower 95% limits of agreement indicated by grey dotted lines. VA, visual acuity.
