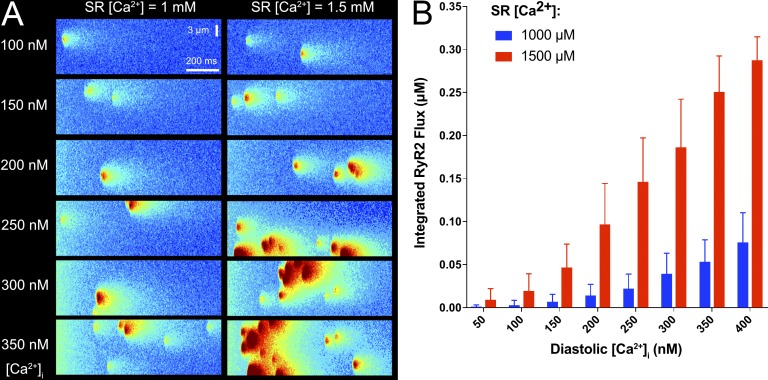
Figure 2.
Contributions of increased SR and diastolic [Ca2+] to unstable Ca2+release. (A) Simulated line-scan images of typical stochastic simulations of Ca2+ sparks and waves. Simulations were performed with a mathematical model of Ca2+ release, as recently described (Wescott et al., 2016). The horizontal dimension represents time (1 s), and the vertical dimension represents transverse distance (14 µm). Labels indicate initial values of cytosolic and SR [Ca2+]. Each SR Ca2+ release unit contains a cluster of 50 stochastically gating RyR2s (see Wescott et al. [2016] for more details), and RyR2 clusters are randomly distributed, with a mean intersite distance of 700 nm. Large SR Ca2+ release events involving multiple RyR2 clusters are frequently observed when both SR [Ca2+] and diastolic [Ca2+] are increased (bottom right images). (B) Integrated RyR2 Ca2+release flux as a function of initial diastolic [Ca2+]i when initial SR [Ca2+] is either 1 mM (blue) or 1.5 mM (red). Flux is integrated over each 1-s simulation and averaged over 50 trials. Error bars show standard deviation.

