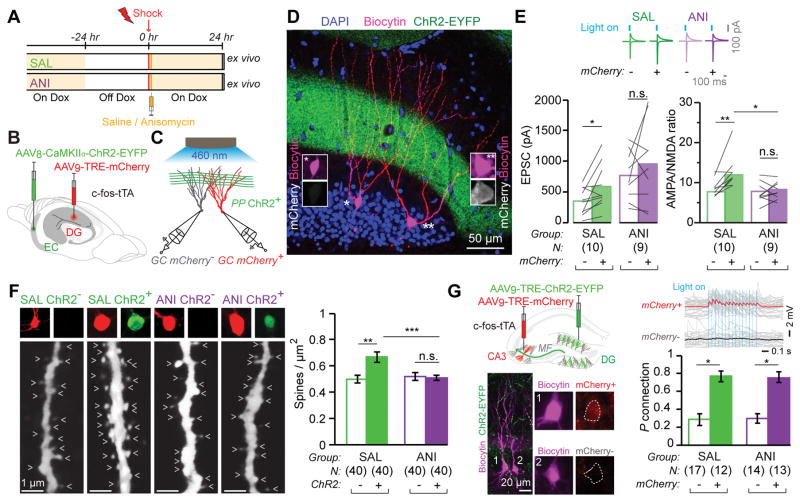
Figure 1. Synaptic Plasticity and Connectivity of Engram Cells.
(A) Mice taken Off DOX 24 hrs before contextual fear conditioning (CFC) and dispatched 24 hrs post training. Saline (SAL) or anisomycin (ANI) administered immediately after training.
(B) AAV8-CaMKIIα-ChR2-EYFP and AAV9-TRE-mCherry viruses injected into the entorhinal cortex and dentate gyrus, respectively, of c-fos-tTA mice.
(C) Paired recordings of engram (red) and non-engram (grey) DG cells during optogenetic stimulation of ChR2+ perforant path (PP) axons.
(D) Representative image of a pair of recorded biocytin-labeled engram (mCherry+) and non-engram (mCherry−) DG cells. Note ChR2+ PP axons in green.
(E) (Top) Example traces of AMPA and NMDA receptor-dependent postsynaptic currents in mCherry+ and mCherry− cells, evoked by light activation of ChR2+ PP axons. (Bottom) EPSC amplitudes and AMPA/NMDA current ratios of mCherry+ and mCherry− cells of the two groups are displayed as means (columns) and individual paired data points (grey lines). Paired t-test * p < 0.05, ** p < 0.001. SAL group compared with the ANI group, unpaired t-test * p < 0.05.
(F) (Left) Representative confocal images of biocytin filled dendritic fragments derived from SAL and ANI groups for ChR2+ and ChR2− cells (arrow heads: dendritic spines). (Right) Average dendritic spine density showing an increase occurring exclusively in ChR2+ fragments. Data are represented as mean ± SEM. Unpaired t tests ** p < 0.01, *** p < 0.001.
(G) Engram Connectivity. (Top left) AAV9-TRE-ChR2-EYFP and AAV9-TRE-mCherry viruses, injected into the DG and CA3, respectively, of c-fos-tTA mice. (Bottom left) Example of mCherry+ (1) and mCherry− (2) biocytin-filled CA3 pyramidal cells. Note ChR2+ mossy fibers (MF) in green. (Top Right) mCherry+ cell but not mCherry− cell displayed EPSPs in response to optogenetic stimulation of MF. (Bottom Right) Probability of connection of DG ChR2+ engram axons and CA3 mCherry+ and mCherry− cells. Error bars are approximated by binomial distribution. Fisher’s exact test: * p < 0.05.

