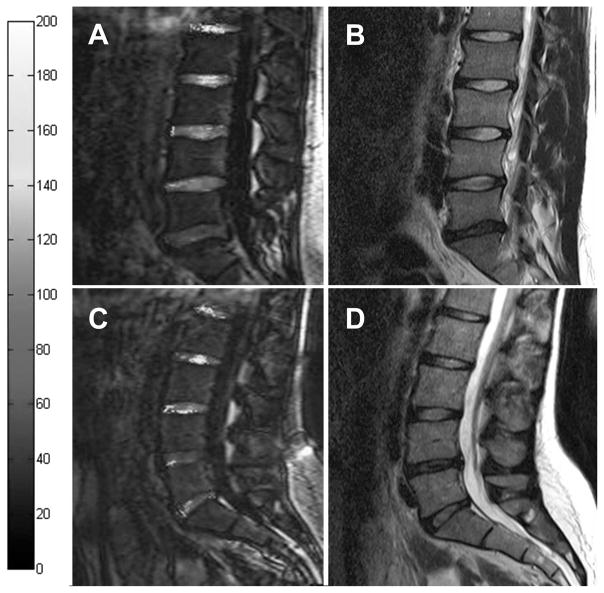
Figure 1.
Representative T1ρ map overlaid on T1ρ image (A and C) and T2-weighted images (B and D) from a 23-year-old man (A and B) and a 24-year-old woman (C and D). The L1–L2 and L2–L3 discs are nondegenerative with relatively high T1ρ relaxation times in both sexes. In contrast, the L3–L4 discs show a normal T2-signal intensity on T2-weighted images and a significant decrease of T1ρ value in both subjects. The L4 and L5–S1 show a distinct loss of signal intensity on T2 imaging and a dramatic decrease in T1ρ time in women and men, respectively.

