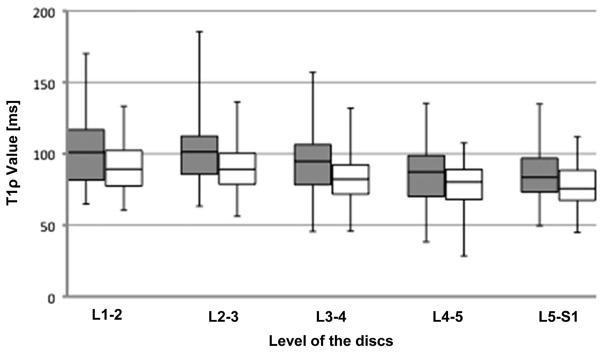
Figure 3.
Box plots of T1ρ value of nucleus pulposus by sex according to the anatomic level of each disc. Gray = Male; white = Female. The boxes represent the median and the interquartile range, with the vertical lines showing the range. The graph shows a significant lower T1ρ value in the female discs at L3–L4 and L4–L5 discs than that in the male discs. * P < 0.05.

