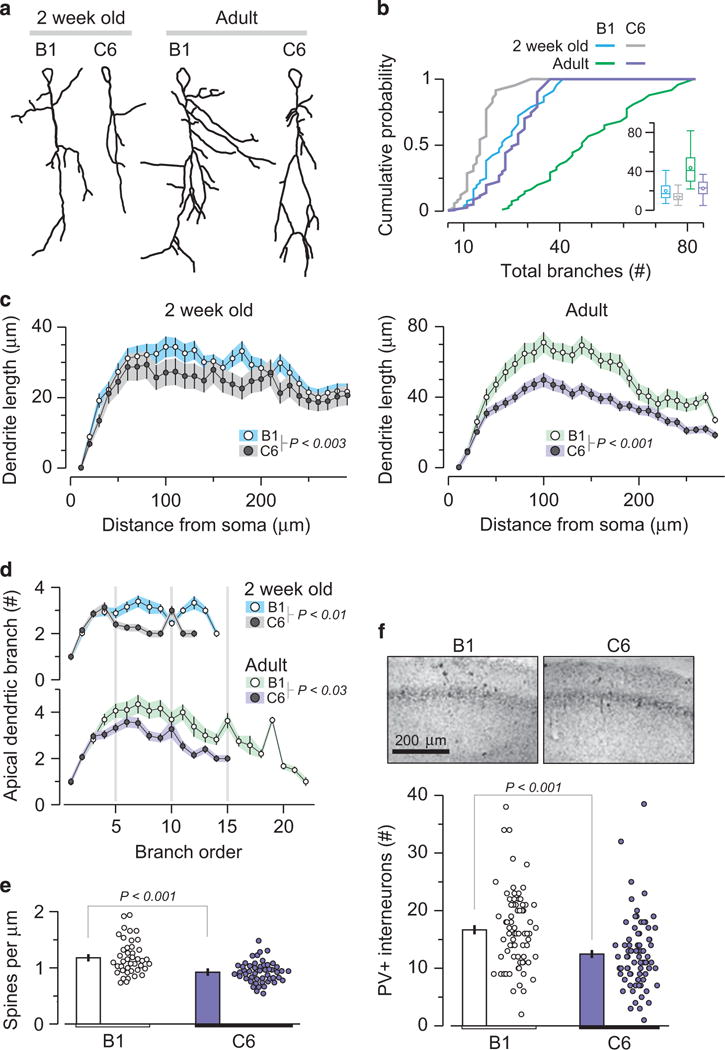
Figure 3.

C6-exposed male offspring display significantly reduced hippocampal dendritic complexity. CAI pyramidal neurons of C6-exposed male mice show reduced dendritic length and spine density. Analysis includes: 2-week-old mice (n=4 per group); neurons: B1 = 45, C6 = 49 and adult animals (n = 4 per group); neurons: B1 = 70, C6 = 83. Each group includes animals from two litters. (a) Traced drawings of representative Golgi-impregnated CA1 pyramidal neurons from 2-week-old (left) and adult (16–20-week old) (right) B1- and C6-exposed mice. (b) Cumulative probability of total number of branches. 2-week-old B1 vs C6, P < 0.003, D = 0.35, Kolmogorov-Smirnov (KS) test; adult, P < 0.001, D = 0.64, KS test. Insert, box plot, represents total number of branches, with data presented as mean and quartiles. (c) Scholl analysis depicts dendritic length as a function of distance from the soma. Left: 2-week-old mice, P < 0.005, D = 0.44, KS. Right: adult mice, P < 0.001, D = 0.97, KS test. (d) Number of dendritic branches as a function of branch order, centrifugally defined to start at the origin of the tree and continue out towards the termination, and as the number of segments traversed from the origin. The C6- and B1-exposed mice differ significantly at both ages: 2-week-old, P < 0.01, D = 0.6, KS test; adult, P < 0.03, D = 0.45, KS test. (e) Reduced density of synaptic dendritic spines in CA1 neurons in C6-exposed male mice. Dots represent individual dendrites. B1 = 1.18 ± 0.04 spines μm−1; c6 = 0.92 ± 0.02 spines μm−1; P < 0.001, t = 4.78, t-test. (f) Top, representative photomicrographs of the CA1 field showing labeled PV+ interneurons. Bottom, quantification of PV+ neurons in adult B1 (n = 1251) and C6 (n = 998) groups, P < 0.001, Z = 4.25, Mann-Whitney, four animals per group, two litters.
