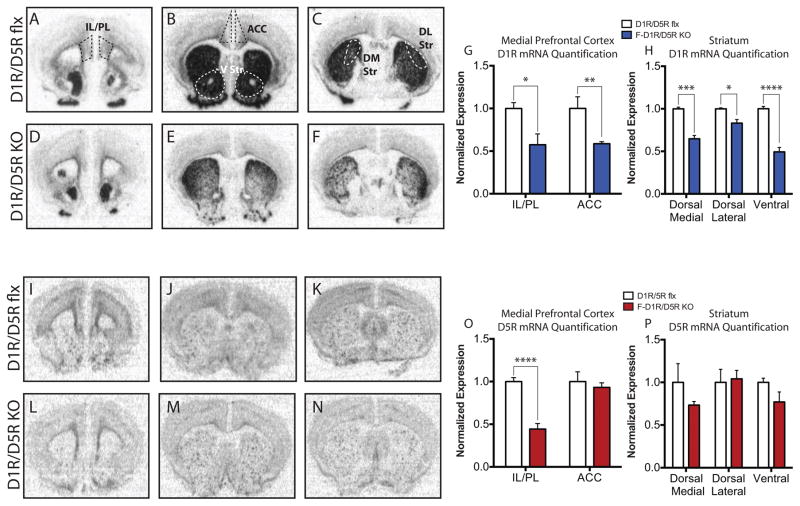
Figure 1. Pattern and Quantification of D1R and D5R Expression.
(A) IL/PL D1R mRNA expression. (B) ACC and ventral (V) striatum D1R mRNA expression (C) dorsal medial (DM) and dorsal lateral (DL) striatum D1R mRNA expression. (A–C) Black or white dashed lines indicate regions of interest used to quantify D1R and D5R mRNA signal. (D) IL/PL D1R mRNA expression in F-D1R/D5R KO mice. (E) ACC and V striatum D1R mRNA expression in F-D1R/D5R KO mice. (F) DM and DL striatum D1R mRNA expression in F-D1R/D5R KO mice. (G) Quantification of IL/PL and ACC D1R mRNA signal (D1R/D5R flx IL/PL, n = 7 and F-D1R/D5R KO IL/PL, n = 6; D1R/D5R flx ACC, n = 4 and F-D1R/D5R KO ACC = 6). (H) Quantification of DM, DL, and V striatum D1R mRNA signal (D1R/D5R flx DM/DL, n = 3 and F-D1R/D5R KO DM/DL, n = 6; D1R/D5R flx V striatum, n = 6 and F-D1R/D5R KO V striatum = 3). (I) IL/PL D5R mRNA expression. (J) ACC and V striatum D5R mRNA expression (K) DM and DL striatum D5R mRNA expression. (L) IL/PL D5R mRNA expression in F-D1R/D5R KO mice. (M) ACC and V striatum D5R mRNA expression in F-D1R/D5R KO mice (N) DM and DL striatum D5R mRNA expression in F-D1R/D5R KO mice. (O) Quantification of IL/PL and ACC D5R mRNA signal (D1R/D5R flx IL/PL, n = 5 and F-D1R/D5R KO IL/PL, n = 5; D1R/D5R flx ACC, n = 3 and F-D1R/D5R KO ACC = 5). (P) Quantification of DM, DL, and V striatum D5R mRNA signal in F-D1R/D5R KO (D1R/D5R flx DM/DL/V striatum, n = 3 and F-D1R/D5R KO DM/DL/V striatum, n = 4). * denotes P value < 0.05, ** P value < 0.01, *** P value < 0.001, **** P value < 0.0001.

