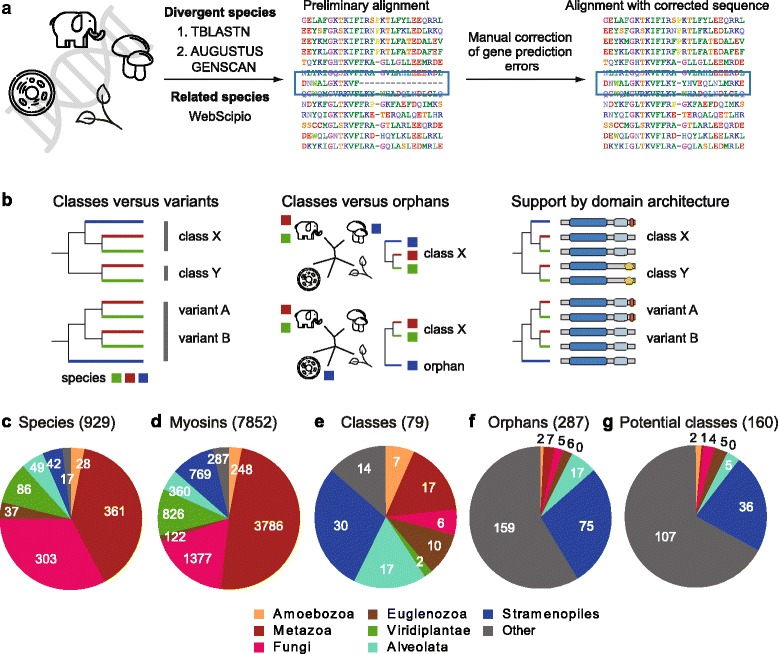
Fig. 1.

Dataset statistics. (a) Scheme of the myosin identification and manual gene reconstruction process. (b) Rationale for choosing appropriate nodes for myosin classification. (c) Number of species within selected major taxa. Only taxa with more than five species in subtaxa were selected. The remaining species were grouped as “others”. Although the analysed species are dominated by metazoans, fungi and plants, myosin repertoires were also identified for 173 species from other taxa. (d) Number of annotated myosins per taxon. Again, most myosins were derived from metazoans, fungi and plants, but there are also 1786 myosins from other species. (e) Number of myosin classes per taxon. Please note that some classes are shared between the selected taxa, and thus the total number of classes is lower than the sum of the classes shown in the pie chart. Although the analysis is dominated by metazoan, fungal and plant myosins, the myosin divergence is similarly complex in other taxa. (f) Number of “orphans” (currently unclassified myosins) per taxon. Most of the orphans belong to taxa with low taxonomic sampling, e.g. the genomes of only one or two species of the respective taxon are available. (g) If the 271 orphans were classified based on phylogenetic grouping and domain architecture, this would result in further 160 classes, of which most would belong to so far underrepresented taxa
