Fig. 1.

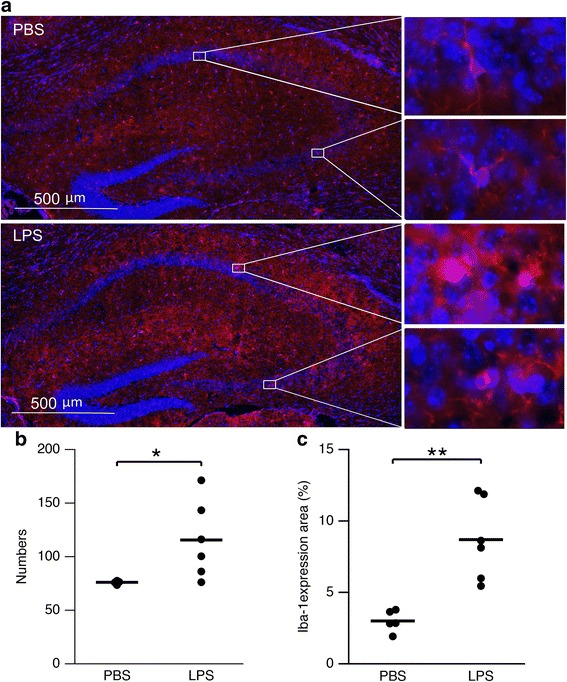
LPS exposure in utero generated long-term changes in glial appearance in the hippocampus on 45 DPN. a Micrograph showing increased microgliosis (red) in the hippocampus of LPS-exposed mouse. Insets on the right show enlarged image of CA1 and CA3 area. b Scatterplot of microglia cell number in the hippocampus from PBS (n = 5)- and LPS (n = 6)-exposed mice. Asterisks indicate p < 0.05. c Scatterplot of Iba-1 expression area in the hippocampus from PBS (n = 5)- and LPS (n = 6-exposed mice. Asterisks indicate p < 0.01
