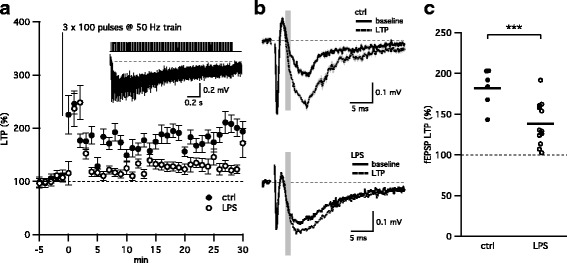
Fig. 4.

LPS exposure in utero reduces LTP formation. a Time course (mean ± SEM) of the normalized fEPSP response (slope) before (− 5–0′) and after LTP induction (0–30′). Gray line and inset above demonstrate a 50-Hz stimulation train and typical response elicited by LTP stimulation protocol (3 × 100 pulses at 50 Hz). b Representative average of 10 fEPSPs from a single experiment before (baseline, black) and after LTP induction (LTP, dash). Gray bars highlight the regions where fEPSP initial slopes were measured. c Scatterplot depicting the reduced levels of LTP observed in mice exposed to LPS in utero. Asterisks indicate p < 0.001
