
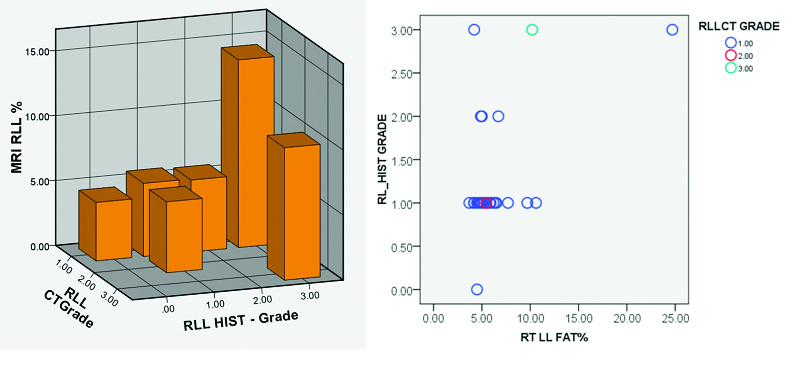
[Table/Fig-3]:
Distribution of fat in right lobe of liver segments by CT and histological correlation. chart, representative 3-D bar diagram and scatter graph.
| Correlations | ||||||
|---|---|---|---|---|---|---|
| Test used | RLLCT | RL_HIST | Liv5 | Liv6 | Liv7 | |
| RLLCT | Pearson Correlation | 1 | 0.396* | -0.014 | 0.101 | 0.022 |
| Sig. (2-tailed) | 0.030 | 0.942 | 0.594 | 0.909 | ||
| N | 30 | 30 | 30 | 30 | 30 | |
| RL_HIST | Pearson Correlation | 0.396* | 1 | 0.460* | 0.512** | 0.458* |
| Sig. (2-tailed) | 0.030 | 0.011 | 0.004 | 0.011 | ||
| N | 30 | 30 | 30 | 30 | 30 | |
| Liv5 | Pearson Correlation | -0.014 | 0.460* | 1 | 0.966** | 0.942** |
| Sig. (2-tailed) | 0.942 | 0.011 | <0.001 | <0.001 | ||
| N | 30 | 30 | 30 | 30 | 30 | |
| Liv6 | Pearson Correlation | 0.101 | 0.512** | 0.966** | 1 | 0.958** |
| Sig. (2-tailed) | 0.594 | 0.004 | <0.001 | <0.001 | ||
| N | 30 | 30 | 30 | 30 | 30 | |
| Liv7 | Pearson Correlation | 0.022 | 0.458* | 0.942** | 0.958** | 1 |
| Sig. (2-tailed) | 0.909 | 0.011 | 0.000 | 0.000 | ||
| N | 30 | 30 | 30 | 30 | 30 | |
| Liv8 | Pearson Correlation | -0.062 | 0.406* | 0.926** | 0.914** | 0.961** |
| Sig. (2-tailed) | 0.746 | 0.026 | <0.001 | <0.001 | <0.001 | |
| N | 30 | 30 | 30 | 30 | 30 | |
| RT | Pearson Correlation | 0.152 | 0.510** | 0.938** | 0.960** | 0.956** |
| Sig. (2-tailed) | 0.422 | 0.004 | <0.001 | <0.001 | <0.001 | |
| N | 30 | 30 | 30 | 30 | 30 | |
 | ||||||
*. Correlation is significant at the 0.05 level (2-tailed).
**. Correlation is significant at the 0.01 level (2-tailed).
*HIST – Histology, CT – Computed tomography, MRI – Magnetic resonance imaging, RLL – Right lobe of liver, Liv= Liver