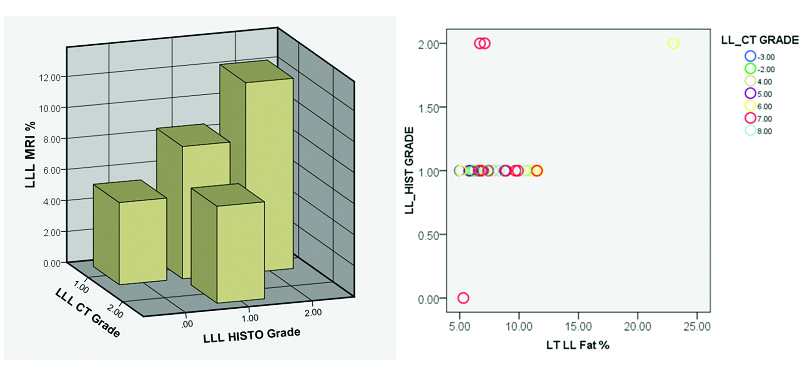
[Table/Fig-4]:
Distribution of fat in left lobe of liver segments by CT and histological correlation. chart, representative 3-D bar diagram and scatter graph.
| Correlations | |||||||
|---|---|---|---|---|---|---|---|
| LL_HIST | LLCT | Liv2 | Liv3 | Liv4 | @LT | ||
| LL_HIST | Pearson Correlation | 1 | -0.073 | 0.309 | 0.449* | 0.446* | 0.402* |
| Sig. (2-tailed) | 0.702 | 0.132 | 0.015 | 0.015 | 0.031 | ||
| N | 30 | 30 | 25 | 29 | 29 | 29 | |
| LLCT | Pearson Correlation | -0.073 | 1 | -0.344 | -0.316 | -0.236 | -0.263 |
| Sig. (2-tailed) | 0.702 | 0.092 | 0.095 | 0.217 | 0.169 | ||
| N | 30 | 30 | 25 | 29 | 29 | 29 | |
| Liv2 | Pearson Correlation | 0.309 | -0.344 | 1 | 0.896** | 0.868** | 0.838** |
| Sig. (2-tailed) | 0.132 | 0.092 | <0.001 | <0.001 | <0.001 | ||
| N | 25 | 25 | 25 | 25 | 24 | 25 | |
| Liv3 | Pearson Correlation | 0.449* | -0.316 | 0.896** | 1 | 0.870** | 0.895** |
| Sig. (2-tailed) | 0.015 | 0.095 | <0.001 | <0.001 | <0.001 | ||
| N | 29 | 29 | 25 | 29 | 28 | 29 | |
| Liv4 | Pearson Correlation | 0.446* | -0.236 | 0.868** | 0.870** | 1 | 0.832** |
| Sig. (2-tailed) | 0.015 | 0.217 | <0.001 | <0.001 | <0.001 | ||
| N | 29 | 29 | 24 | 28 | 29 | 28 | |
| @LT | Pearson Correlation | 0.402* | -0.263 | 0.838** | 0.895** | 0.832** | 1 |
| Sig. (2-tailed) | 0.031 | 0.169 | <0.001 | <0.001 | <0.001 | ||
| N | 29 | 29 | 25 | 29 | 28 | 29 | |
 | |||||||
*. Correlation is significant at the 0.05 level (2-tailed).
**. Correlation is significant at the 0.01 level (2-tailed).
HIST – Histology, CT – Computed tomography, MRI – Magnetic resonance imaging, LLL – Left lobe of liver, Liv= Liver
