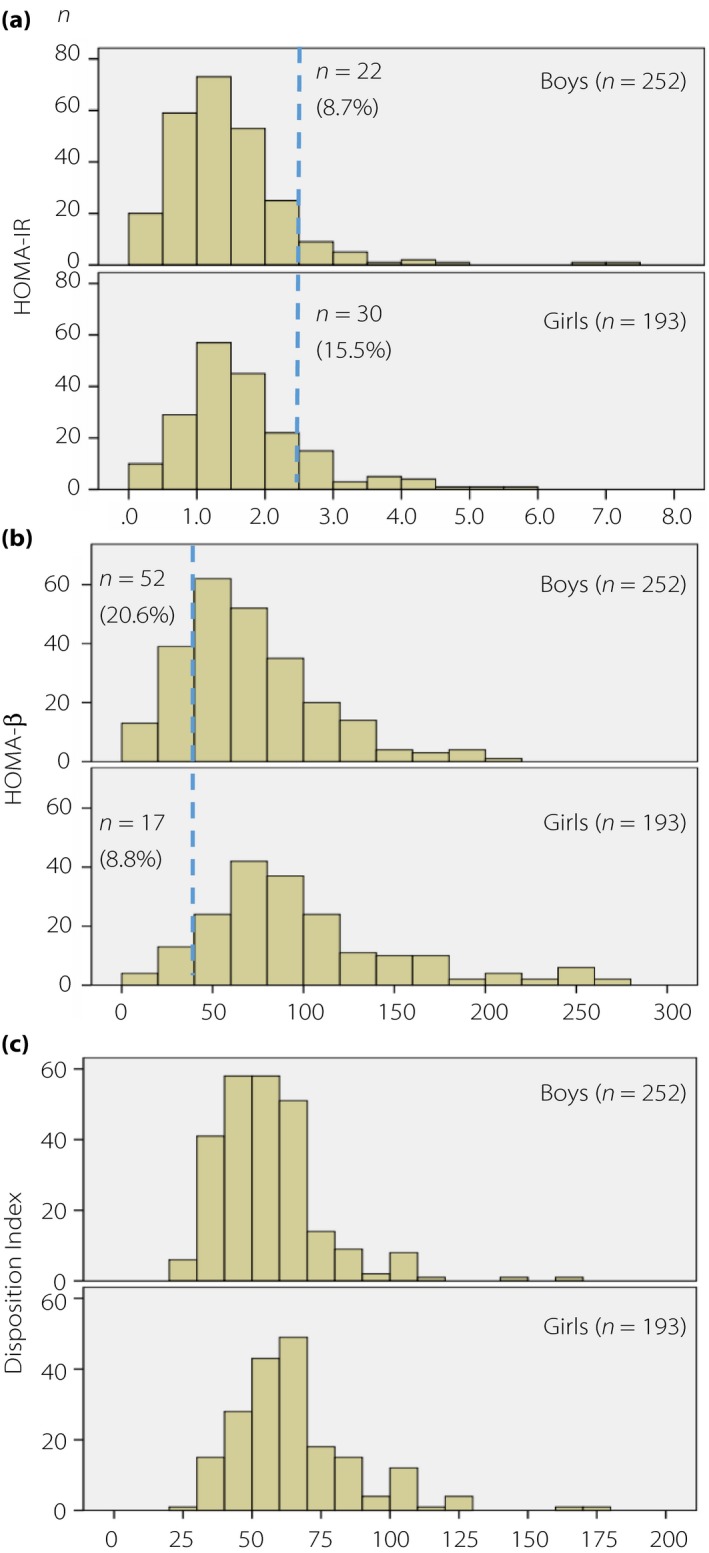
Figure 1.

Distribution of (a) homeostasis model assessment of insulin resistance (HOMA‐IR) values and the proportion of participants with HOMA‐IR ≥2.5; (b) homeostasis model assessment of β‐cell function (HOMA‐β) values and proportion of participants with HOMA‐β <40; and (c) Disposition Index values by sex.
