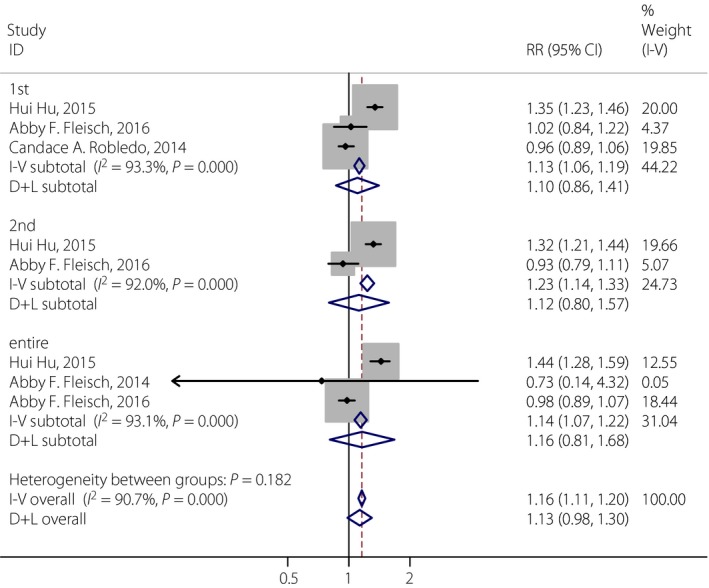
Figure 4.

Forest plot of meta‐analysis in the associations between particulate matter 2.5 and gestational diabetes mellitus in different pregnancy trimesters (the first, the second and the entire period). 95% CI, 95% confidence interval; D+L, DerSimonian‐Laird; I‐V, inverse variance; RR, relative risk.
