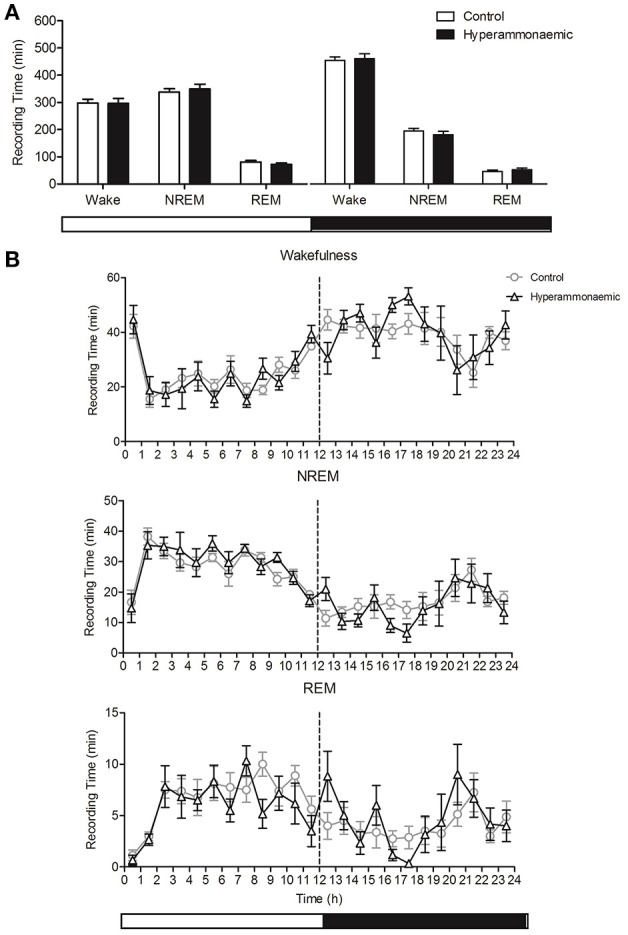
Figure 3.

(A) Comparison of the total time (min) spent in Wake-NREM-REM state, in the light (left) and dark (right) period, between control (white bars) and hyperammonemic (black bars) animals, during the spontaneous sleep-wake cycle. (B) Comparison of Wakefulness, NREM and REM sleep profile (min/hour) between control (circles) and hyperammonemic (triangles) animals, during the spontaneous sleep-wake cycle.
