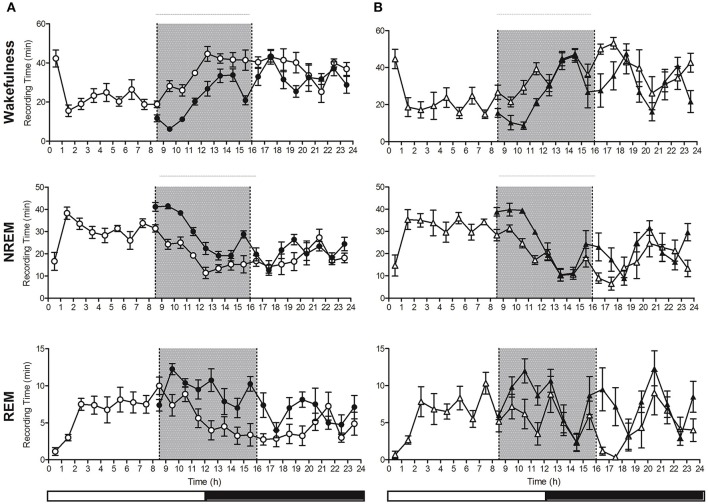
Figure 4.
Hourly distribution of the time (minutes; mean ± SEM) spent in Wakefulness/NREM/REM at baseline (open symbols) and during the recovery period (closed symbols) in control (A; n = 8, circles) and hyperammonemic rats (B; n = 6, triangles). Analysis of recovery was performed on both the 9–16 h (gray portion of the graphs) and 9–24 h intervals. Statistical analysis of wakefulness, NREM and REM (presented in Table 1), was performed by comparing the differences between baseline and sleep deprivation in the control group (A) as well as baseline and sleep deprivation in the ammonium-treated group (B) [repeated measures ANOVA of the mathematical difference between baseline and recovery (in minutes), by group; Table 1].

