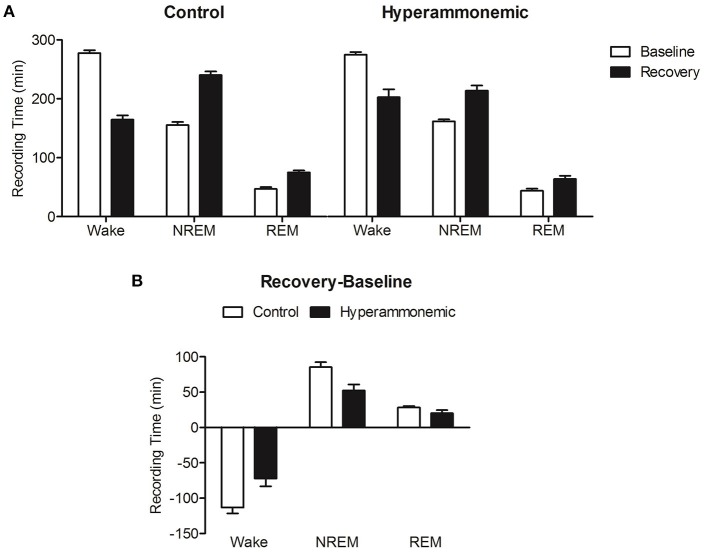
Figure 5.
(A) Decrease in Wakefulness time (min) and increase in NREM and REM sleep time after sleep deprivation (9–16 h, black bars) with respect to baseline (white bars), in control (left) and hyperammonemic (right) animals. (B) Comparison of the differences (recovery minus baseline, 9–16 h) in Wakefulness, NREM and REM sleep time (min) between control (white bars) and hyperammonemic (black bars) animals.

