Figure 7.

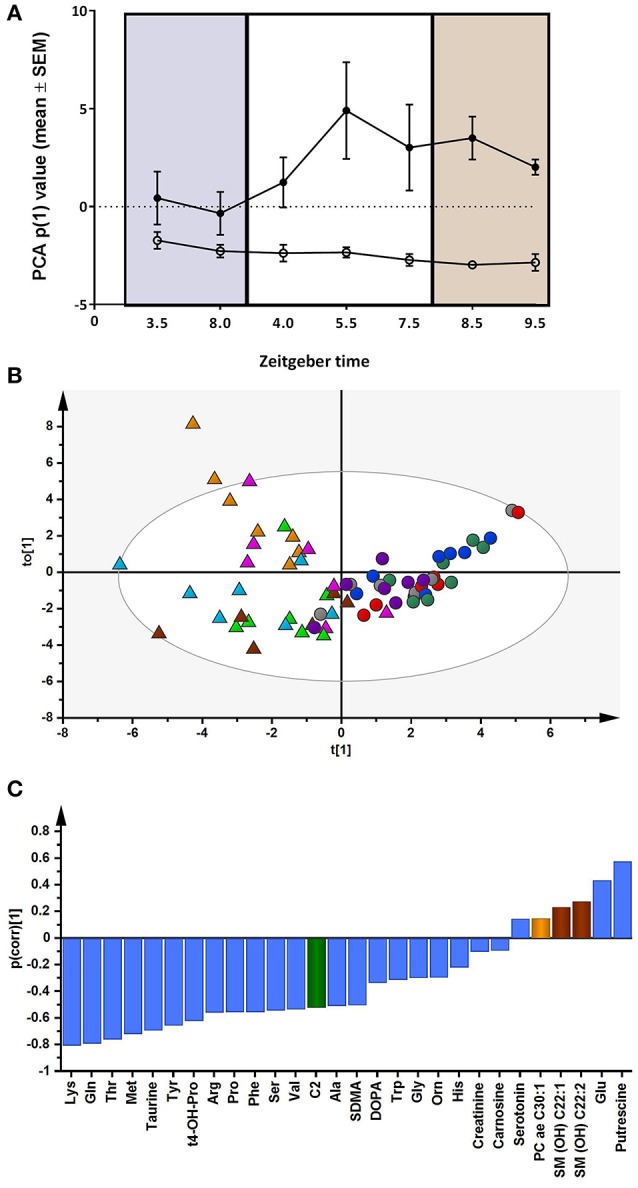
(A) Principal component analysis (PCA) of all the metabolite data (n = 28 metabolites). The change in mean score (±SEM) on PC1 in the control (n = 5, closed circles) and hyperammonemic animals (n = 5, open circles) across the time course (baseline, purple; during sleep deprivation, white; after sleep deprivation, orange) is shown. (B) Orthogonal partial least squares discriminant analysis (OPLS-DA) model showing separation by condition [Q2 (cumulative) = 0.575, R2X (cumulative) = 0.493; R2Y (cumulative) = 0.651]. Each animal is color coded; triangles represent control animals; circles represent hyperammonemic animals. (C) OPLS-DA p(corr) loading plot of control vs. hyperammonemic animals. Negative p(corr) values represent decreased and positive p(corr) values represent increased metabolite concentrations in hyperammonemic animals compared to controls. The metabolite bars are color coded according to metabolite class as follows: amino acids and biogenic amines (blue); acylcarnitines (green); phosphatidylcholine acyl-akyl (PC ae) (light orange); sphingolipids (SM) (brown).
