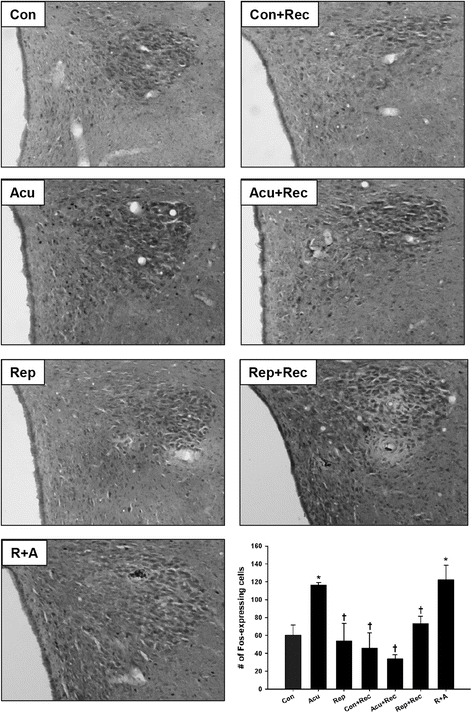
Fig. 1.

Stress-induced expression of Fos in the PVH. Representative photomicrographs are provided for PVH sections from each treatment group immunohistochemically stained for Fos. The bar graph displays quantitative results of the total number of Fos-positive cells in Control (Con), Acutely stressed (Acu), Repeatedly Stressed (Rep), Control plus Recovery (Con + Rec) Acute plus Recovery (Acu + Rec), Repeated plus Recovery (Rep + Rec), and Repeated plus Recovery plus Acute (R + A) animals. Bars are Mean ± SEM. n = 3 for each group, except Rep where n = 4. Symbols: *, significantly different (p < 0.05) from Con; †, significantly different (p < 0.05) from Acu
