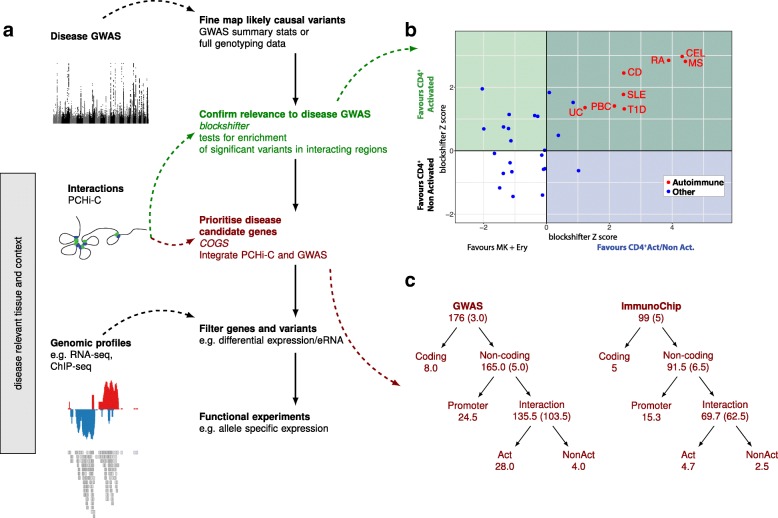
Fig. 4.
An experimental framework for identifying disease-causal genes. a Before prioritising genes, enrichment of GWAS signals in PCHi-C interacting regions should be tested to confirm the tissue and context are relevant to disease. Then, probabilistic fine-mapping of causal variants from the GWAS data can be integrated with the interaction data to prioritise candidate disease-causal genes, a list which can be iteratively filtered using genomic datasets to focus on (differentially) expressed genes and variants which overlap regions of open or active chromatin. b Autoimmune disease GWAS signals are enriched in PIRs in CD4+ T cells generally compared to control cells (blockshifter Z score, x-axis) and in PIRs in activated compared to non-activated CD4+ T cells (blockshifter Z score, y-axis). Text labels correspond to datasets described in Additional file 6: Table S5. c Genes were prioritised with a COGS score > 0.5 across five autoimmune diseases using genome-wide (GWAS) or targeted genotyping array (ImmunoChip) data. The numbers at each node give the number of genes prioritised at that level. Where there is evidence to split into one of two non-overlapping hypotheses (log10 ratio of gene scores > 3), the genes cascade down the tree. Act and NonAct correspond to gene scores derived using PCHi-C data only in activated or non-activated cells, respectively. Where the evidence does not confidently predict which of the two possibilities is more likely, genes are ‘stuck’ at the parent node (number given in brackets). When the same gene was prioritised for multiple diseases, we assigned fractional counts to each node, defined as the proportion of the n diseases for which the gene was prioritised at that node. Because of duplicate results between GWAS and ImmunoChip datasets, the total number of prioritised genes is 252 (see Table 1)

