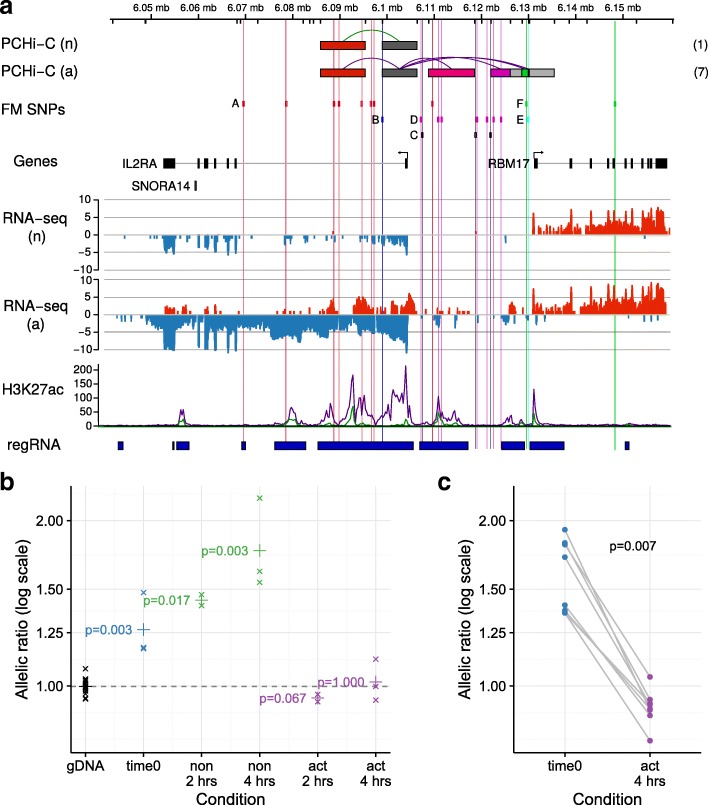
Fig. 6.
PCHi-C interactions link the IL2RA promoter to autoimmune disease-associated genetic variation, which leads to expression differences in IL2RA mRNA. a The ruler shows chromosome location, with HindIII sites marked by ticks. The top tracks show PIRs for prioritised genes in non-activated (n) and activated (a) CD4+ T cells. Green and purple lines are used to highlight those PIRs containing credible SNPs for the autoimmune diseases T1D and MS fine mapped on chromosome 10p15. Six groups of SNPs (A–F) highlighted in Wallace et al. [26] are shown, although note that group B was found unlikely to be causal. The total number of interacting fragments per PCHi-C bait is indicated in parentheses for each gene in each activation state. Dark grey boxes indicate promoter fragments; light grey boxes, PIRs containing no disease-associated variants; and coloured boxes, PIRs overlapping fine-mapped disease-associated variants. PCHi-C interactions link a region overlapping group A in non-activated and activated CD4+ T cells to the IL2RA promoter (dark grey box) and regions overlapping groups D and F in activated CD4+ T cells only. RNA-seq reads (log2 scale, red = forward strand, blue = reverse strand) highlight the upregulation of IL2RA expression upon activation and concomitant increases in H3K27ac (non-activated, n, green line; activated, a, purple line) in the regions linked to the IL2RA promoter. Red vertical lines mark the positions of the group A SNPs. Numbers in parentheses show the total number of IL2RA PIRs detected in each state. Here we show those PIRs proximal to the IL2RA promoter. Comprehensive interaction data can be viewed at https://www.chicp.org. b Allelic imbalance in mRNA expression in total CD4+ T cells from individuals heterozygous for group A SNPs using rs12722495 as a reporter SNP in non-activated (non) and activated (act) CD4+ T cells cultured for 2 or 4 h, compared to genomic DNA (gDNA, expected ratio = 1). Allelic ratio is defined as the ratio of counts of T to C alleles. ‘x’ = geometric mean of the allelic ratio over 2–3 replicates within each of 4–5 individuals; p values from a Wilcoxon rank sum test comparing complementary DNA (cDNA) to gDNA are shown. ‘+’ shows the geometric mean allelic ratio over all individuals. c Allelic imbalance in mRNA expression in memory CD4+ T cells differs between ex vivo (time 0) and 4-h activated samples from eight individuals heterozygous for group A SNPs using rs12722495 as a reporter SNP. p value from a paired Wilcoxon signed rank test is shown

