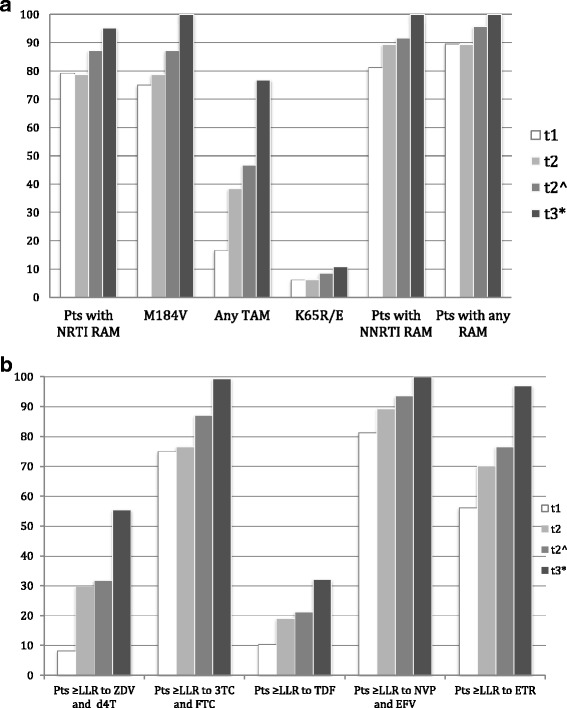
Fig. 1.

a Proportion of patients with major resistance mutations at t1* (first documented HIV RNA >1000 copies/mL at 1 year of ART) and t2 *(continued HIV RNA >1000 copies/mL at 2 years of ART). t2^ represents the cumulative resistance summing resistance at t1 and t2. t3 represents the projection of resistance at 3 years based on t1 and t2^ and assuming absence of resistance at baseline. b Proportion of patients with predicted resistance to individual drugs at t1 and t2 and the projection at 3 years. * t1 total patients n = 48, t2 total patients n = 47; NRTI, nucleoside/nucleotide reverse-transcriptase inhibitor; NNRTI, non-nucleoside reverse-transcriptase inhibitor; PIs, protease inhibitors; RAM, resistance-associated mutations; TAM thymidine analog mutation; LLR, low-level resistance according to the interpretation by hivdb v 7.0; ZDV, zidovudine; 3TC, lamivudine; TDF, tenofovir; NVP, nevirapine; EFV, efavirenz; ETR, etravirine
