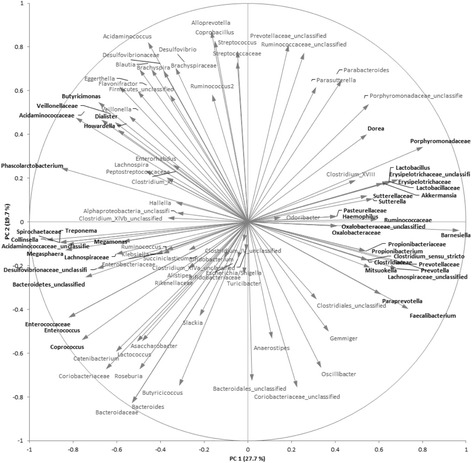
Fig. 8.

Variables (taxa) correlation plot. Each vector represents a taxonomic group (family or genus levels). Shorter vectors only slightly contribute for differentiation between groups. Longer vectors have a bigger weight in groups’ differentiation. Those variables that mostly contribute the first component (PC1) are indicated in bold text
