Fig. 1.

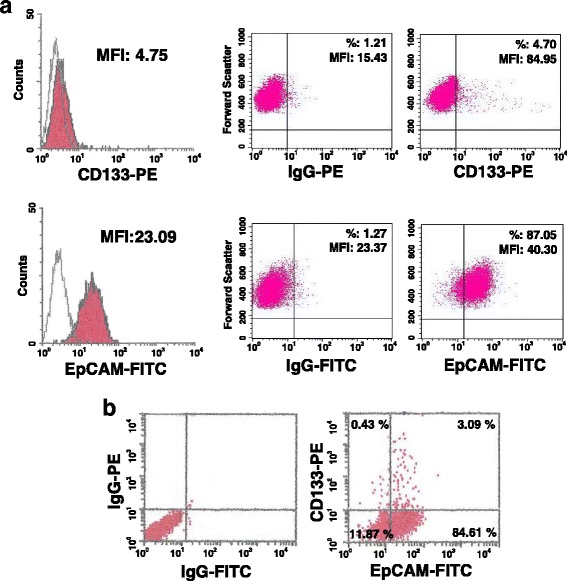
Expression of CD133 and EpCAM in MDA-MB-231 cells. In a representative cytofluorimetrical evaluation of CD133 and EpCAM surface levels in MDA-MB-231 cells after labelling with a PE-conjugated anti-CD133 antibody or with a FITC-conjugated anti-EpCAM antibody. The expression of each antigen is shown, on the left, on a frequency distribution histogram (count vs. PE or FITC signal) in which the mean fluorescence intensity (MFI) of the entire population is reported. The red filled histograms represent positive staining for CD133 or EpCAM and the open histograms, outlined by gray lines, show staining with isotype matched antibodies. On the right, surface expression of each antigen is shown on a biparametric dot plot and the percentage and MFI of positive cells are indicated. In b representative surface expression of both CD133 and EpCAM in MDA-MB-231 cells after double labelling with a PE-conjugated anti-CD133 and with a FITC-conjugated anti-EpCAM antibodies is shown on a biparametric dot plot and the percentage of cells in all the derived quadrants is indicated
