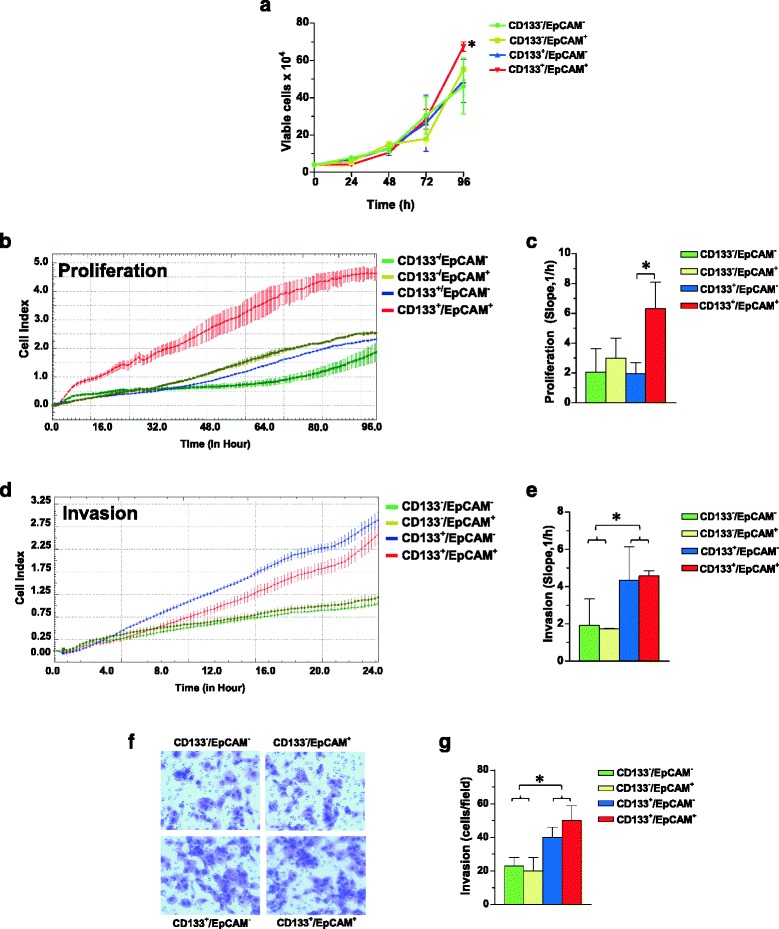
Fig. 3.

CD133 and EpCAM related proliferation and invasion capability of MDA-MB-231 sub-populations. Cells derived from immunomagnetic separations were immediately grown in culture medium for 96 h and daily counted by hemocytometer after Trypan Blue staining (a). After 24 h from separation, the cellular subsets were subjected to dynamic monitoring of proliferation (b) and invasion through Matrigel (d) using the xCELLigence RTCA system. Cell Index (CI) is reported and error bars indicate ±SD. The correspondent Slope analysis, that describes the steepness, incline, gradient, and changing rate of the CI curves over time, is shown in c and e respectively. In f a representative image of ECM invading cells in a Boyden Chamber assay, whose number is reported in g. The data are the mean of three separate experiments ± SD. The asterisks indicate statistically significant differences (P < 0.05)
